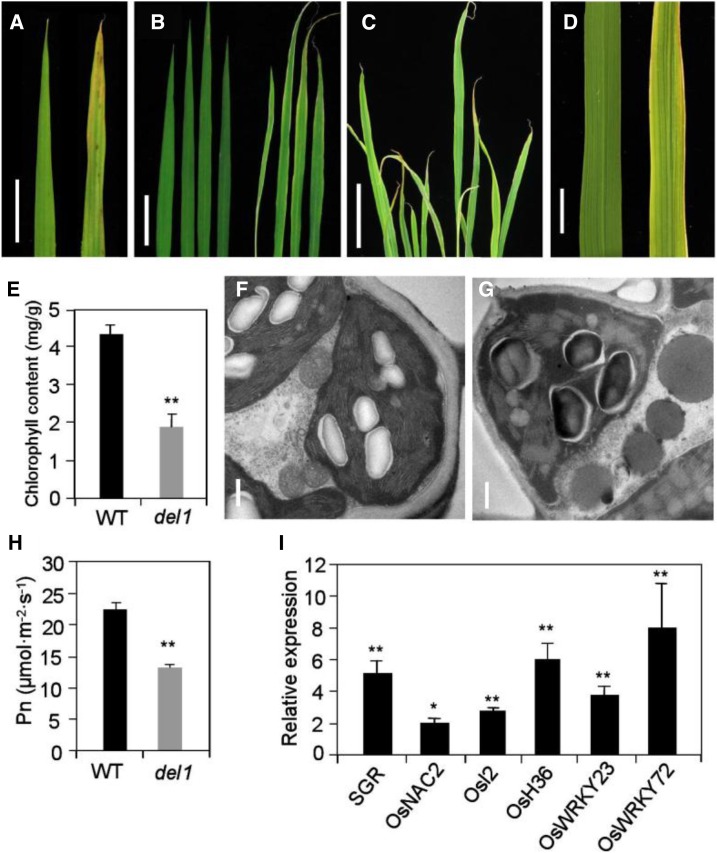
Figure 4.
Leaf phenotype and identification of leaf senescence in DEL1. A to D, Leaf phenotype from young (A), tillering (B and C), and heading (D) stages. Scale bars = 1, 5, 5, and 1 cm in A, B, C, and D, respectively. E, Statistical analysis of chlorophyll content between wild-type and del1 plants, mean ± sd of five independent replicates. **P < 0.01 (Student’s t test). F and G, Transmission electron microscopy analysis of senescence leaves of wild-type (F) and del1 plants (G). Scale bar = 0.5 μm. H, Statistical analysis of photosynthesis rate between wild-type and del1 plants, mean ± sd of five independent replicates. **P < 0.01 (Student’s t test). I, Relative expression levels of senescence-related genes and transcription factors in wild-type and del1 plants, mean ± sd of three independent replicates. *P < 0.05, **P < 0.01 (Student’s t test).

