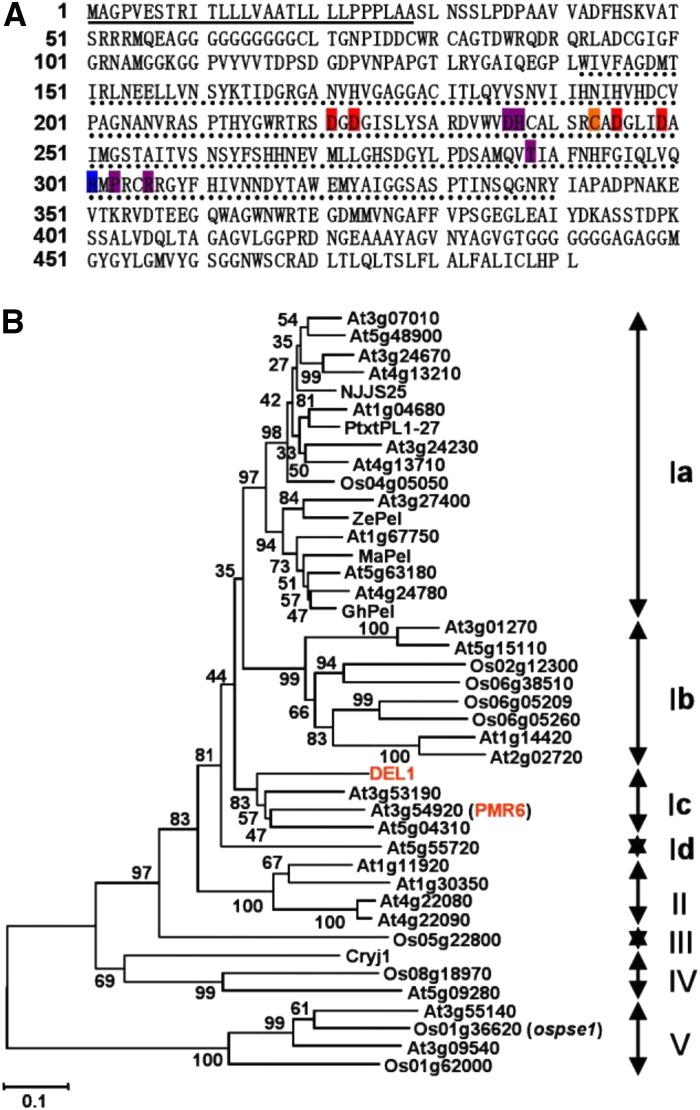
Figure 7.
Prediction of the primary sequence and phylogenetic analysis of DEL1. A, The deduced amino acid sequence of DEL1. Numbers on the left refer to the positions of amino acid residues. The signal peptide is indicated with an underline; the PelC domain is shown by a dotted line; the conserved residues involved in Ca2+ binding (red background), disulfide bonds (orange background), catalysis (blue background), and substrate binding (purple background). B, Phylogenetic tree of PEL in Arabidopsis, rice, and other plants. The numbers at each node represent the bootstrap support (percentage), and scale bar is an indicator of genetic distance based on branch length.

