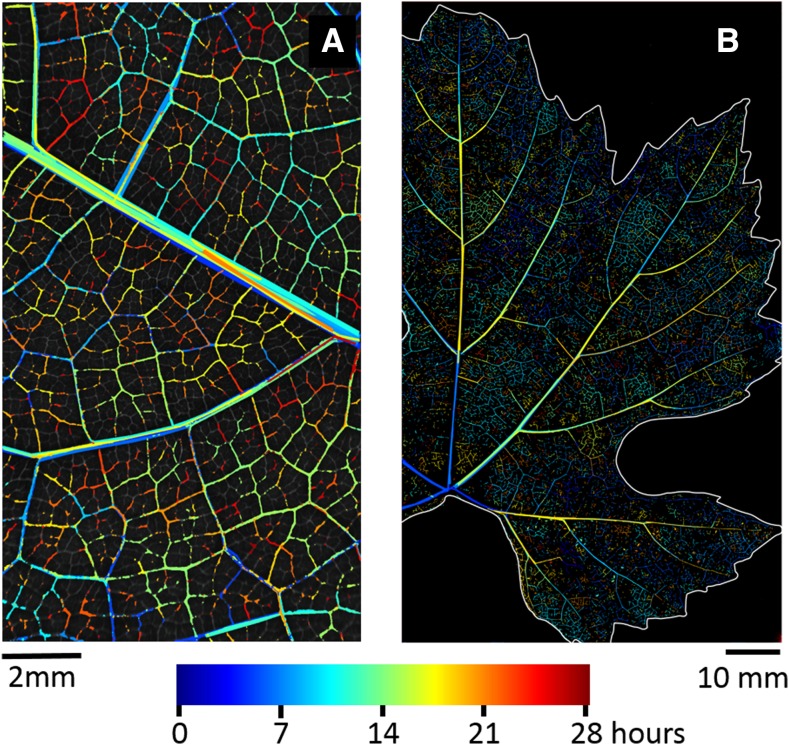
Figure 1.
Embolism spread in a leaf imaged with a microscope (A) or a scanner (B). The largest vein visible in the microscope image (A) is the midrib. Cavitation events are colored according to their time of occurrence. Early cavitation events in the major veins are overlaid with later cavitation events. The full time course of embolism propagation can be observed in Supplemental Movies S1 and S2.

