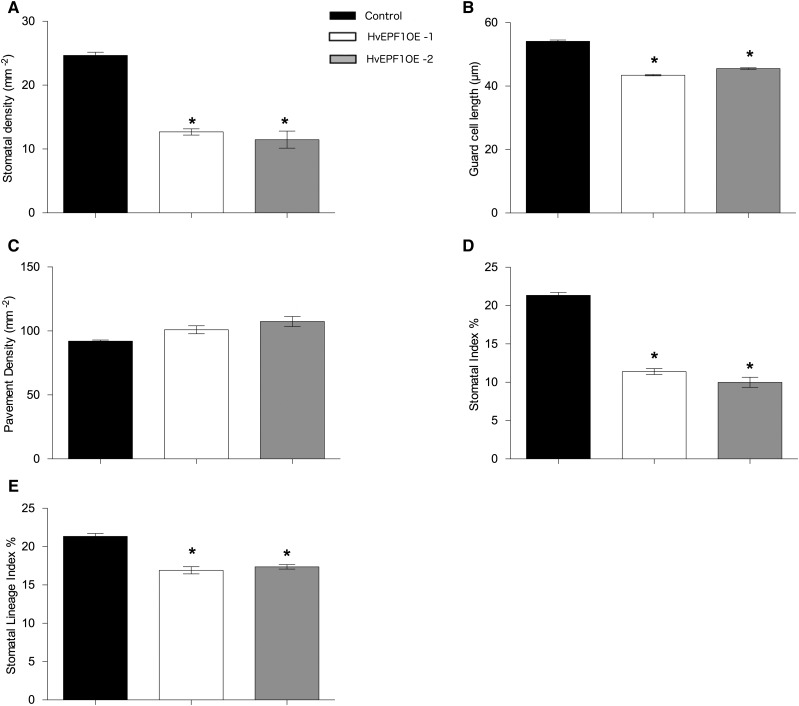
Figure 3.
Stomatal characteristics of barley plants overexpressing HvEPF1. A, Abaxial stomatal densities of HvEPF1 overexpressing T2 barley lines harboring a single copy of the transgene are significantly decreased. HvEPF1OE-1 (white bars) and HvEPF1OE-2 (gray bars) compared to control lines (black bars). B, Guard cell length is significantly decreased in both HvEPF1OE lines. C, Pavement cell density is similar to that of the control in both HvEPF1OE lines. D, Stomatal index is significantly decreased in both HvEPF1OE lines. E, Stomatal lineage index (the ratio of stomata and arrested stomatal precursor cells to the total number of epidermal cells) is significantly decreased in both HvEPF1OE lines. n = 5 plants, asterisks indicate P < 0.05 (Dunnett’s test after one-way ANOVA). Error bars represent se.

