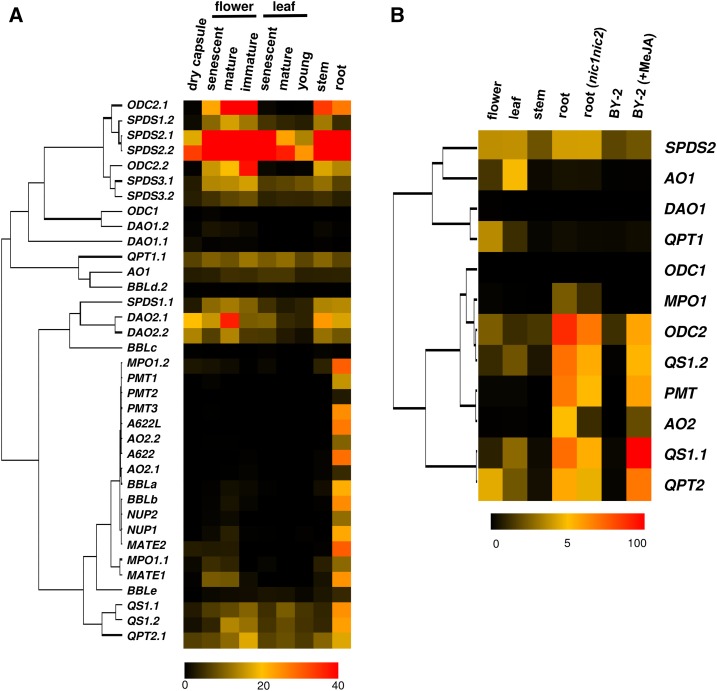
Figure 2.
Heat map visualization of expression data of metabolic genes involved in nicotine and related primary metabolism in tobacco. A, Heat map visualizing FKPM values obtained by RNA-seq analysis. B, Heat map visualizing transcript levels estimated by qRT-PCR analysis. Transcript levels in various organs of tobacco plants and cultured BY-2 cells elicited or not with MeJA were analyzed. Using average values of three biological replicates, the levels are calculated relative to those of EF1α, and are shown relative to the highest one (set to 100) in the data set. Clustering was done with Cluster 3.0 (http://bonsai.hgc.jp/∼mdehoon/software/cluster/software.htm) and heat maps with a tree were drawn with Java TreeView (http://jtreeview.sourceforge.net/).

