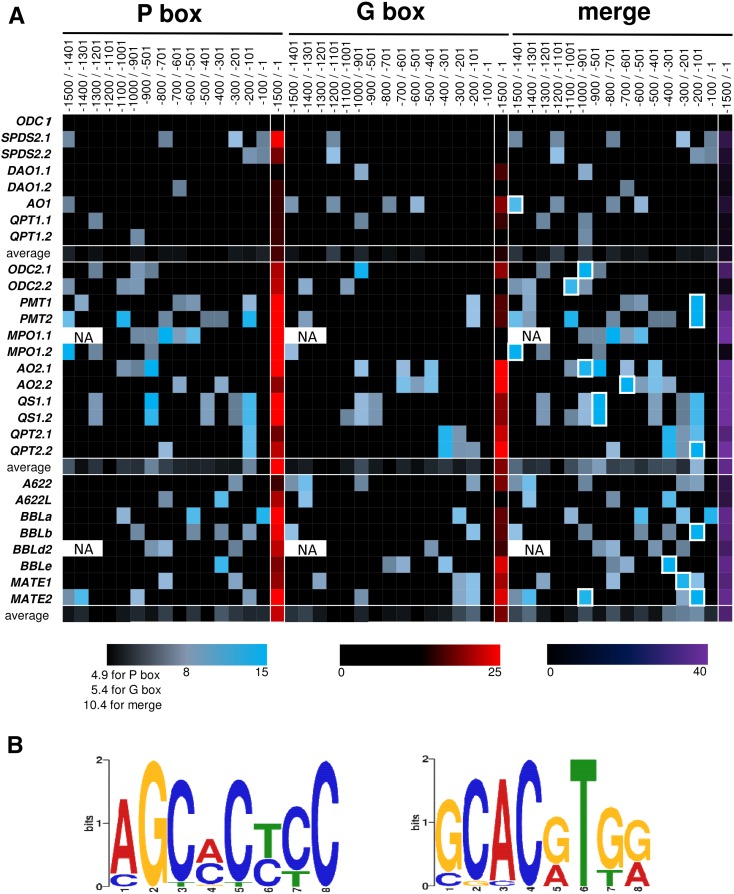
Figure 3.
ERF189-binding P box and MYC2-binding G box elements predicted in 5′-flanking regions from −1,500 to −1 (numbered from the first ATG) of metabolic and transport genes involved in nicotine and related primary metabolism. A, Heat map visualizing distributions of the elements predicted with Regulatory Sequence Analysis Tools (http://rsat.ulb.ac.be/rsat/); elements with scores greater than 5.5 for P box and 5.0 for G box were included. Colors reflect scores of the elements (or sums of those when multiples are predicted) in each bin. At borders between bins, elements were assigned into those proximal to the first ATG. Sums of scores for both boxes are in the right column (merge), where the bins including both P box and G box are squared with white lines. The values are averaged for a gene set in each block. Genomic sequence of a region from −1,500 to −1,200 is not available for MPO1.1 and BBLd.2. PMT3 and BBLc were excluded, because 5′-flanking sequences available were too short (<200 bp). B, Sequence logos representing conservations of sets of sequences related to P box (left) and G box (right) retrieved by MEME analysis from the promoter regions of the genes included in the lower two blocks of (A). NA, Not available.

