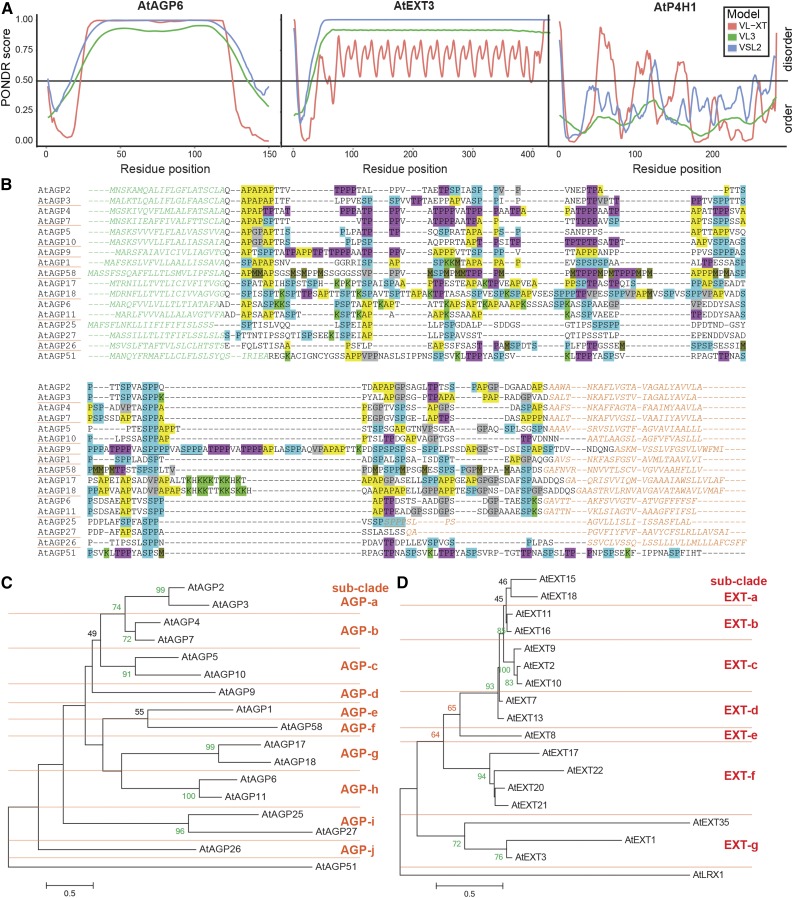
Figure 2.
Disorder prediction, sequence alignment, and phylogenetic trees of the Arabidopsis classical GPI-AGPs and CL-EXTs. A, Protein disorder (PONDR) plots (see “Materials and Methods”) for AtAGP6 (At5g14380; left), AtEXT3 (At1g21310; middle), and prolyl-4-hydroxylase (AtP4H1; At2g43080; right) using VL-XT (red), VL3 (green), and VSL2 (blue). PONDR prediction scores above the threshold line (0.5) predict disorder; below the line, they predict order. B, Sequence alignment (MUSCLE) of 16 Arabidopsis GPI-AGPs with the non-GPI-AGP AtAGP51 included for comparison. Endoplasmic reticulum (ER; N-terminal) and GPI-anchor (C-terminal) signal sequences are colored in green and orange, respectively. Glycomotifs and selected residues are highlighted as follows: AP1-3 (yellow); SP1-2 (blue); SPPP (also found in EXTs; blue underlined); TP1-3 (pink/purple); [G/V]P1-3 (gray); K (bright green); and M (olive green). This shows the diversity and lack of sequence conservation between family members. C, Maximum likelihood tree (MEGA) of Arabidopsis GPI-AGPs and AtAGP51. D, Maximum likelihood tree (MEGA) of Arabidopsis CL-EXT and AtLRX1 (chimeric CL-EXT). In C and D, numbers on the nodes represent support with 100 bootstrap replicates (70 or greater, green; 60–69, orange, 40–59, black) with subclades AGP-a to AGP-j (C) and EXT-a to EXT-g (D; denoted by horizontal lines). Scale bars for branch length measure the number of substitutions per site. The CL-EXT alignment with shaded motifs is shown in Supplemental Figure S2.

