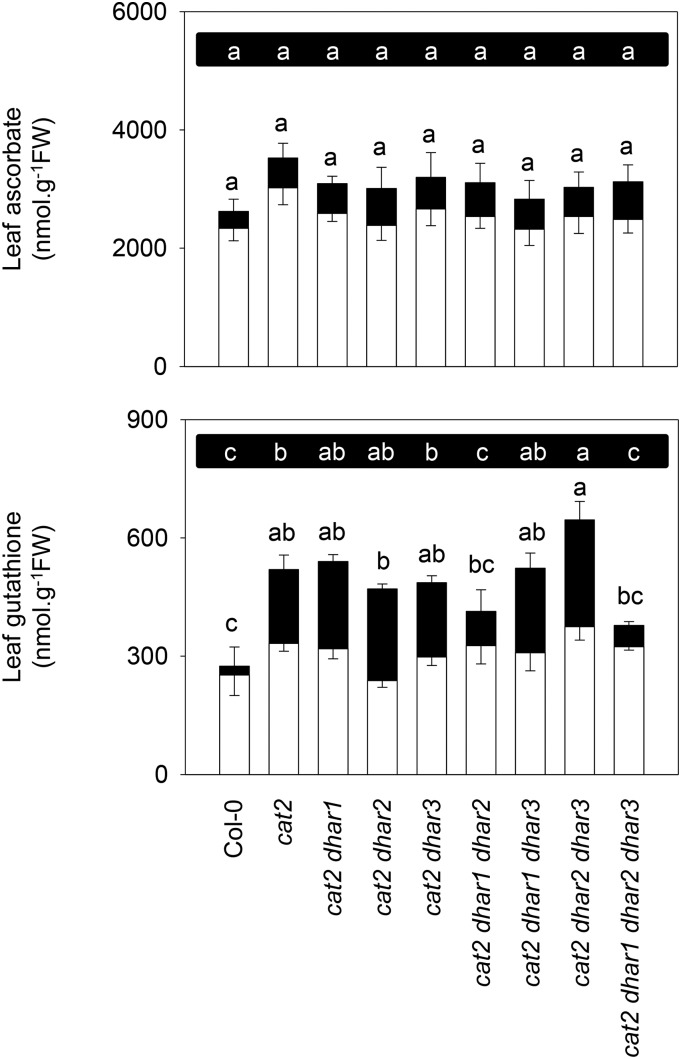
Figure 3.
Effects of dhar mutations on oxidative stress-triggered changes in ascorbate and glutathione. White bars, Reduced forms; black bars, oxidized forms; FW, fresh weight. Values are means ± se of three plants, sampled at 3 weeks at an irradiance of 200 µmol m−2 s−1 in a 16-h photoperiod. Different letters indicate significant differences in oxidized forms (top row of letters on black background) or total contents (bottom row of letters) at P < 0.05 by one-way ANOVA with posthoc Tukey’s honestly significant difference, a test calculator for comparing multiple treatments.

