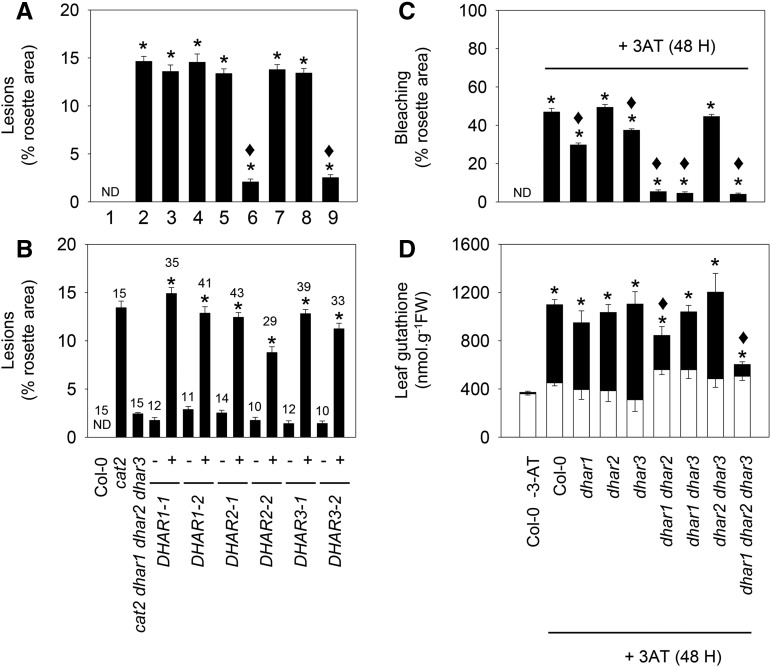
Figure 7.
Influence of dhar mutations on lesions triggered by the cat2 mutation (left) or by the catalase inhibitor 3-amino-1,2,4-triazole (3-AT; right). A, Effects of different dhar mutant combinations on cat2-triggered lesions. Numbers indicate genotypes as follows: 1, Col-0; 2, cat2; 3, cat2 dhar1; 4, cat2 dhar2; 5, cat2 dhar3; 6, cat2 dhar1 dhar2; 7, cat2 dhar1 dhar3; 8, cat2 dhar2 dhar3; and 9, cat2 dhar1 dhar2 dhar3. Asterisks indicate significant differences in percentage of lesions on cat2 background mutant leaves compared with Col-0, and diamonds indicate significant differences when they were compared with cat2, at P < 0.05. ND, Not detected. Values are means ± se of 15 plants. B, Quantification of lesions in the cat2 dhar1 dhar2 dhar3 quadruple mutant retransformed (+) or not (−) with DHAR1, DHAR2, or DHAR3. The number of plants analyzed in complemented lines is indicated above each bar. Asterisks indicate significant differences in percentage of lesions on the complemented line compared with the untransformed quadruple mutant. C, Extent of bleaching in Col-0 and different dhar mutant lines caused by exposure to 2 mm 3-AT. 3-AT was sprayed onto the leaf surface of 3-week-old plants, and lesions were quantified and samples taken 48 h later. Asterisks indicate significant effects of 3-AT treatment compared with nontreated Col-0, and diamonds indicate significant differences between treated dhar mutants and Col-0, at P < 0.05. Values are means ± se of 30 plants. D, Leaf glutathione content after 3-AT treatment. White bars, reduced forms; black bars, oxidized forms; FW, fresh weight. Data are means ± se of three plants. For total glutathione, asterisks indicate significant effects of 3-AT treatment compared with nontreated Col-0, and diamonds indicate significant differences between dhar mutants and Col-0, at P < 0.05.

