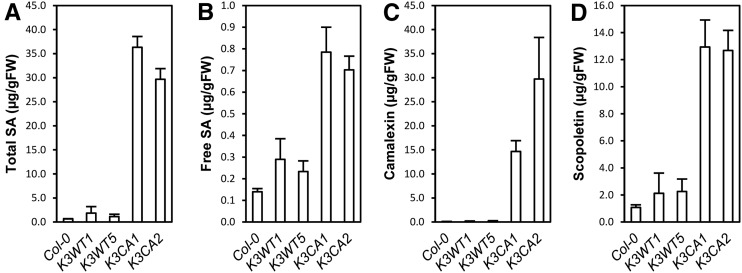
Figure 5.
Characterization of SA and phytoalexin contents in K3CA lines. Total SA (A), free SA (B), camalexin (C), and scopoletin (D) contents were measured by HPLC in the indicated lines. Average contents of four independent biological replicates are represented. Error bars show se. FW, Fresh weight.

