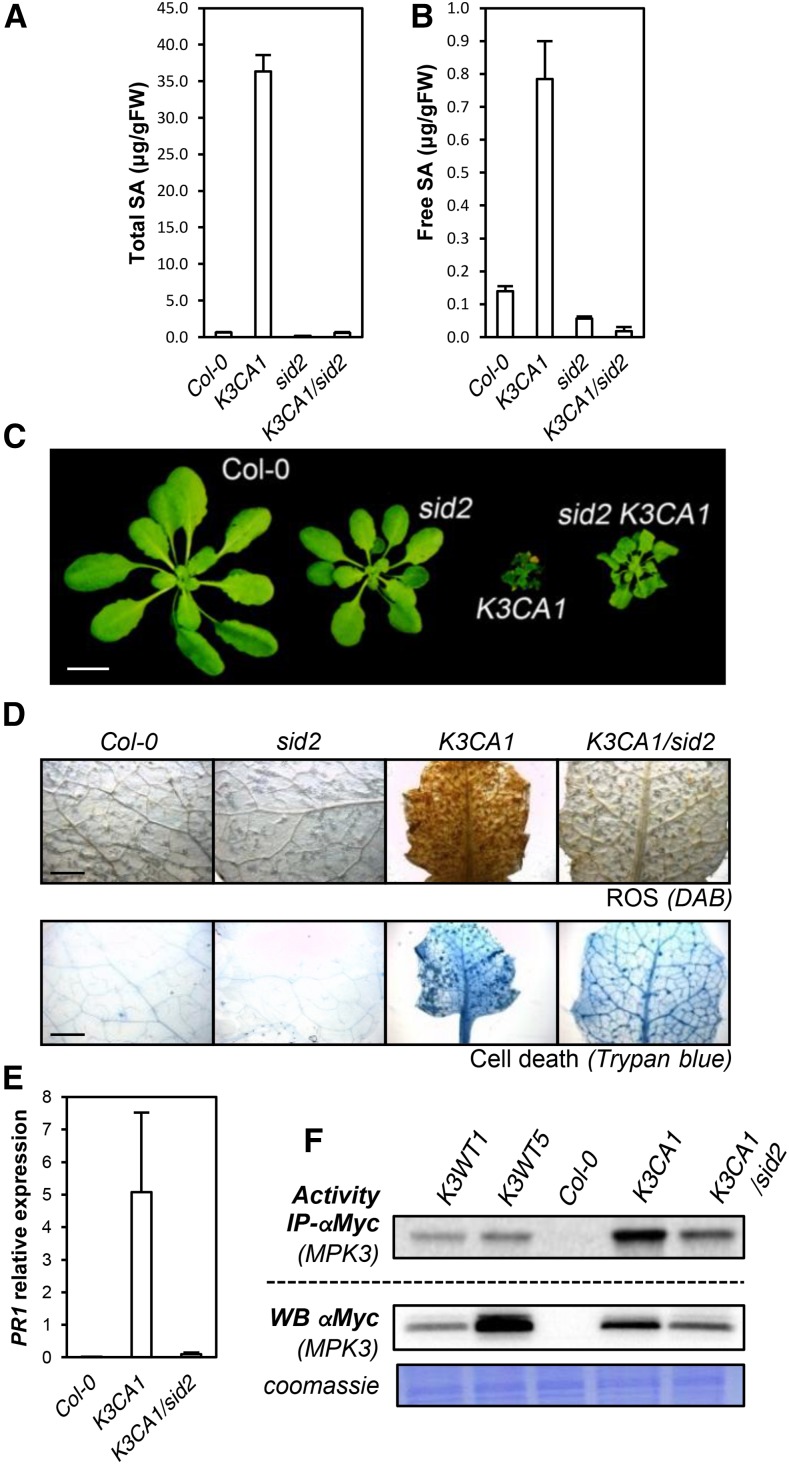
Figure 6.
SA-related phenotypes of K3CA lines. A and B, Total (A) and free (B) SA contents measured by HPLC in the indicated genetic backgrounds. Data are means ± sd of four biological repetitions. FW, Fresh weight. C, Representative photographs of 1-month-old K3CA1/sid2-2 plants compared with parental lines and Col-0. Plants were cultivated at 22°C on soil in a culture chamber. Bar = 1 cm. D, Representative photographs of K3CA1/sid2-2 leaves compared with parental lines and Col-0 stained with DAB and Trypan Blue to visualize ROS and cell death. Bars = 2 mm. E, PR1 transcript levels in the indicated backgrounds. Data are means ± sd of four biological repetitions. F, Kinase activity toward MBP of MPK3-myc immunoprecipitated (IP) from the indicated lines. Western blots (WB) show MPK3-myc levels.

