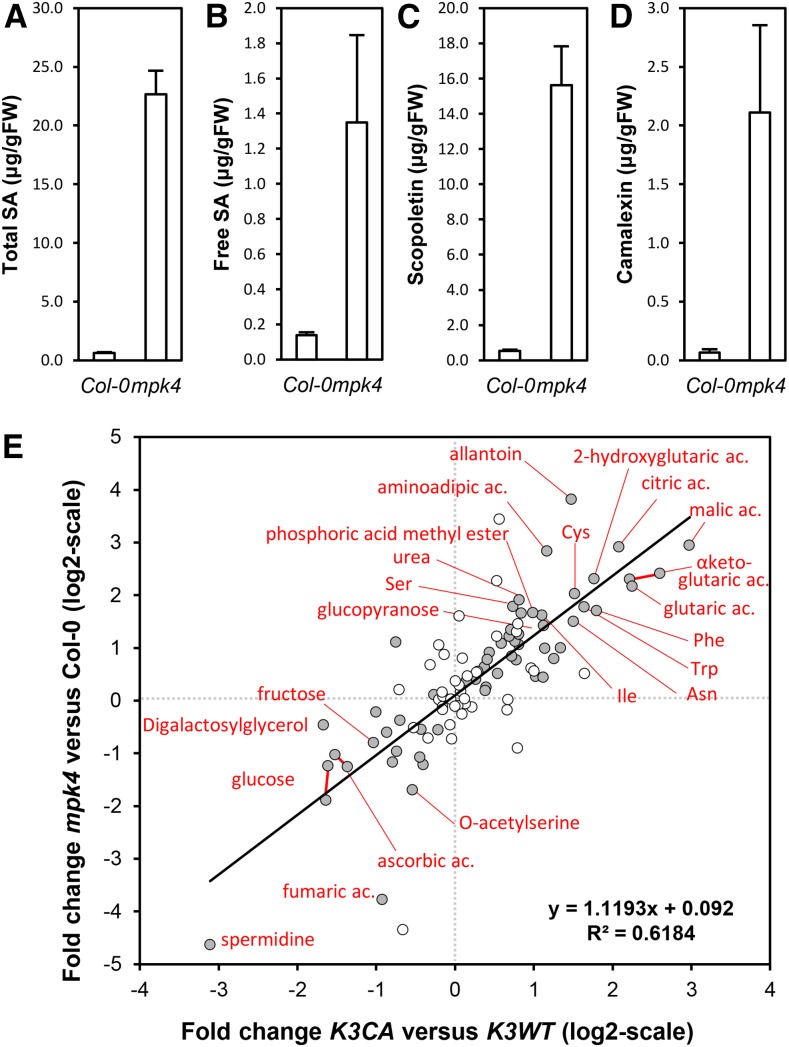
Figure 8.
Comparison of metabolite contents of mpk4 versus K3CA plants. A to D, Total SA (A), free SA (B), scopoletin (C), and camalexin (D) contents of mpk4 measured by HPLC. Data are means ± sd of four biological repetitions. FW, Fresh weight. E, Metabolite analysis of K3CA and mpk4 plants. Means of fold changes (log2) of K3CA/K3WT (x axis) are plotted against means of fold changes (log2) of mpk4/Col-0 (y axis). Gray dots show metabolites that are significantly misaccumulated in K3CA plants (Wilcoxon, Mann-Whitney test with P < 0.05). For clarity, compound names are indicated for fold changes (log2) higher than 1.5 or lower than −1.5.

