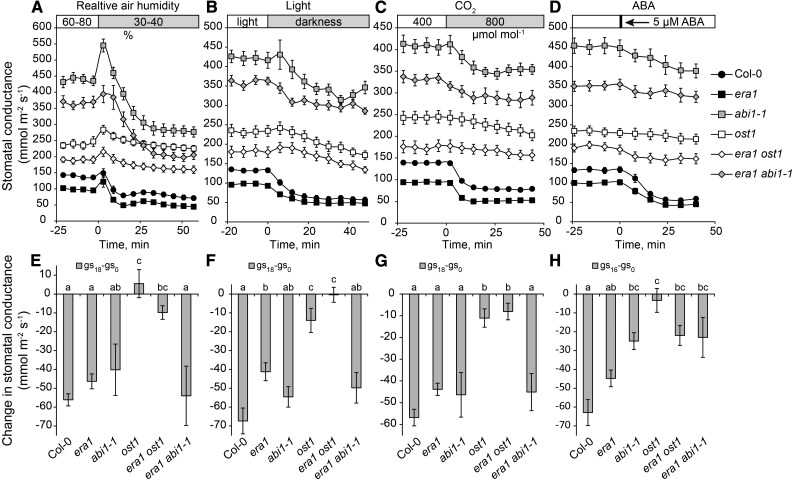
Figure 2.
Stomatal responses of single and double mutants of era1 with ost1 and abi1-1. A to D, Time courses of stomatal conductances in response to reduced air humidity, darkness, elevated CO2, and ABA treatment, respectively. E to H, Changes in stomatal conductance during the first 18 min (except for ABA, where 16 min was measured). Letters denote statistically significant differences between the studied genotypes (ANOVA with Tukey unequal N HSD post hoc test, P < 0.05; n = 6–15).

