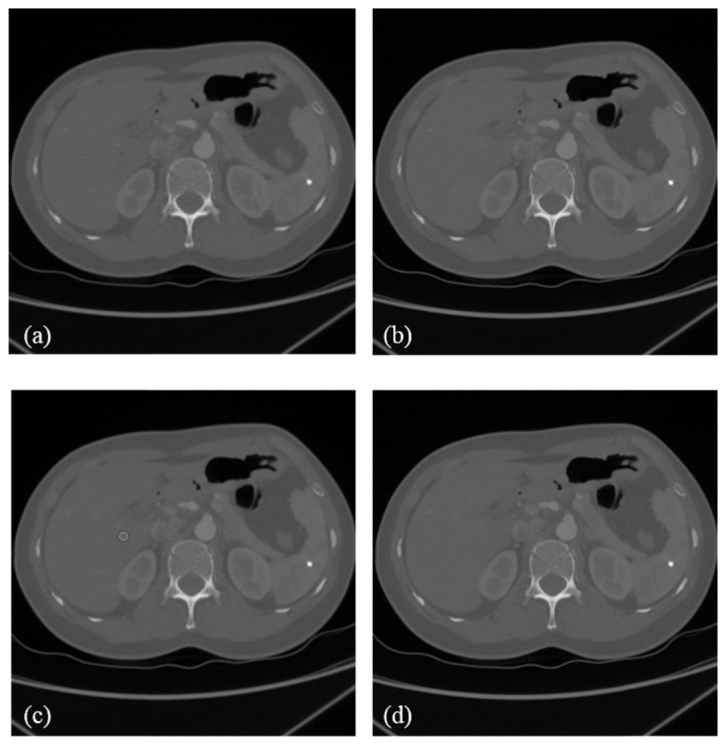
Fig. 6.

Attenuation coefficient distributions. (a) An estimated attenuation coefficient distribution before the K-edge. (b) The original attenuation coefficient distribution before the K-edge. (c) An estimated attenuation coefficient distribution after the K-edge. (d) The original attenuation coefficient distribution after the K-edge. The window display is [0, 3000] HU.
