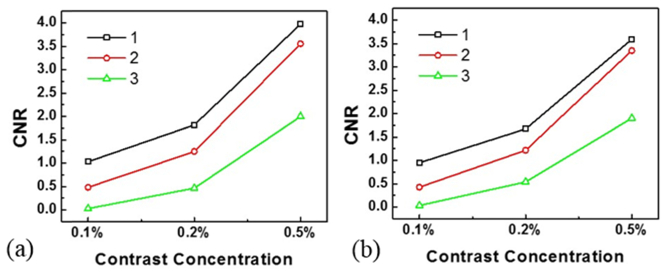
Fig. 7.
CNR comparison study. (a) Comparison of the three methods in the 1.2 cm ROI with different concentrations of the contrast agent. (b) Comparison of the same methods with the 2 cm ROI. Note that 1 represents K-edge imaging in the projection domain, 2 is for the image domain subtraction, and 3 is for conventional CT.

