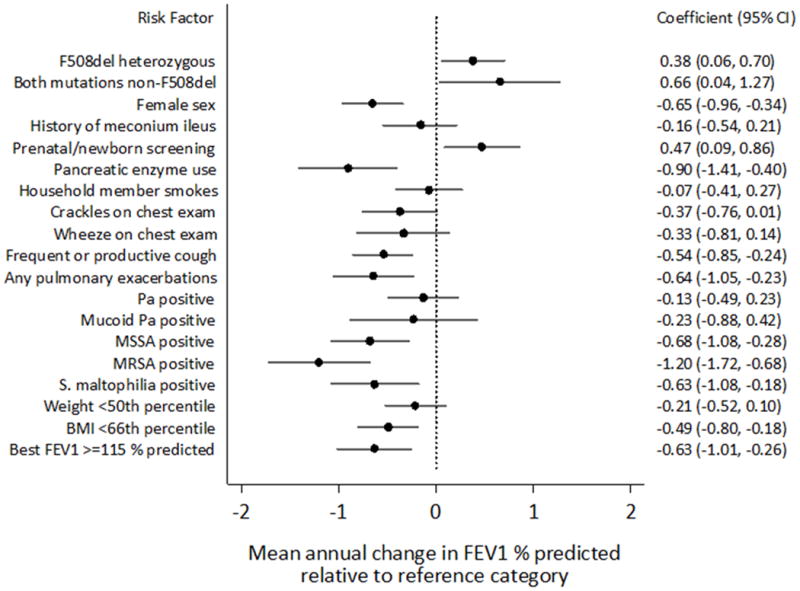
Figure 3.

Forest plot of effect of risk factors on annual change in FEV1% predicted, from univariate GEE models. For each risk factor, estimates of mean annual change in FEV1% predicted and associated 95% confidence intervals are displayed for participants with the risk factor relative to participants in the reference category. All risk factors were measured during the baseline year. Based on evaluation of quartiles, best baseline FEV1% predicted was dichotomized at the top quartile value (115%), and best baseline weight and BMI percentiles were dichotomized at the median value (50th and 66th percentile, respectively).
