
Figure 1. Dreaming experience vs. no experience in NREM sleep (low-frequency power).
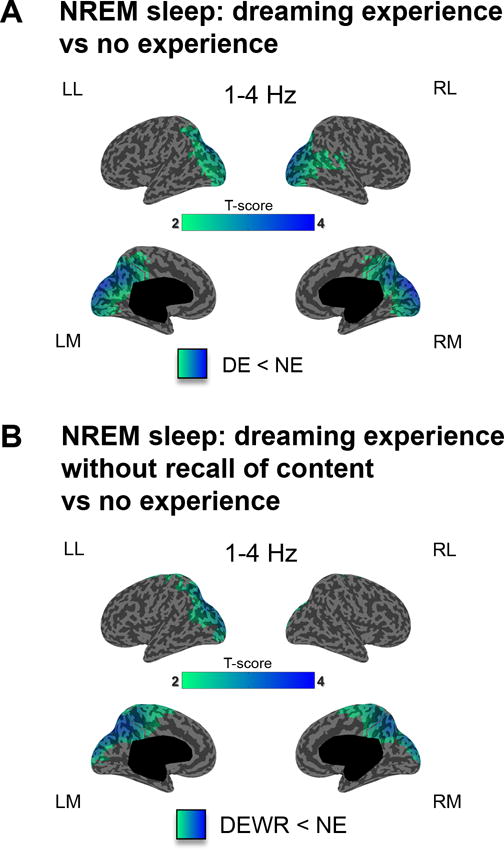
A. Cortical distribution of t-values for the contrast between DEs and NEs at the source level for low-frequency power (1–4 Hz) in NREM sleep (20s before the awakening). p<0.05, after correction for multiple comparisons (two-tailed, paired t-tests, 32 subjects, t(31) > 2.04). B. Same as A for the contrast between NE and DEWR (two-tailed, paired t-tests, 20 subjects, t(19) > 2.09).