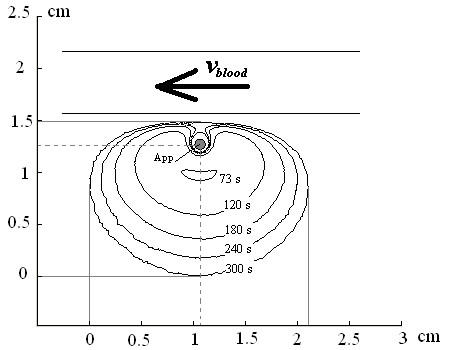
Figure 7.

The interpreted development of the damage zone as a result of the simulation model using the experimental conditions. The applicator is recognized as a grey point in the middle and is indicated with (App). The damage zone starts with an application time of 72 s. The damage zone is presented here at 73 s, 120 s, 180 s, 240 s, and 300 s of application time as indicated in the figure.
