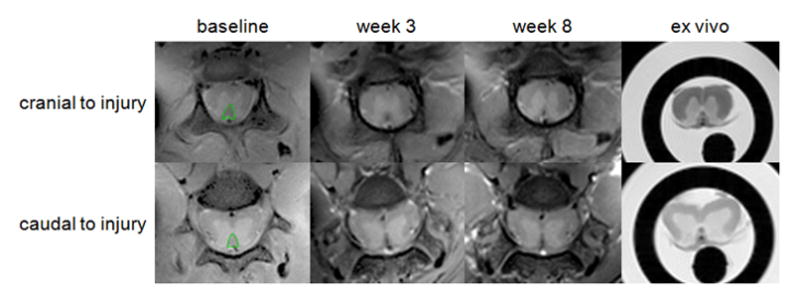
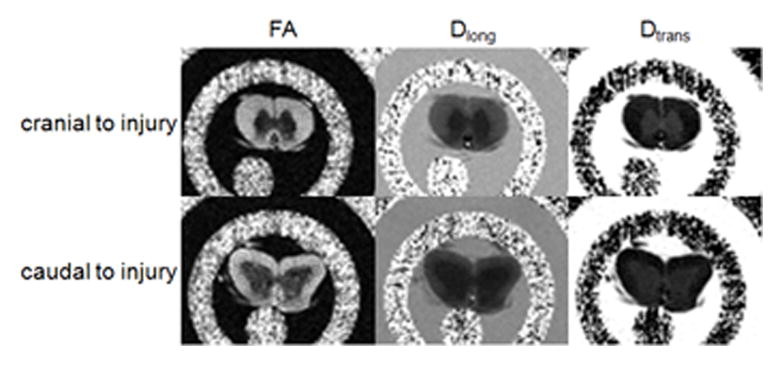
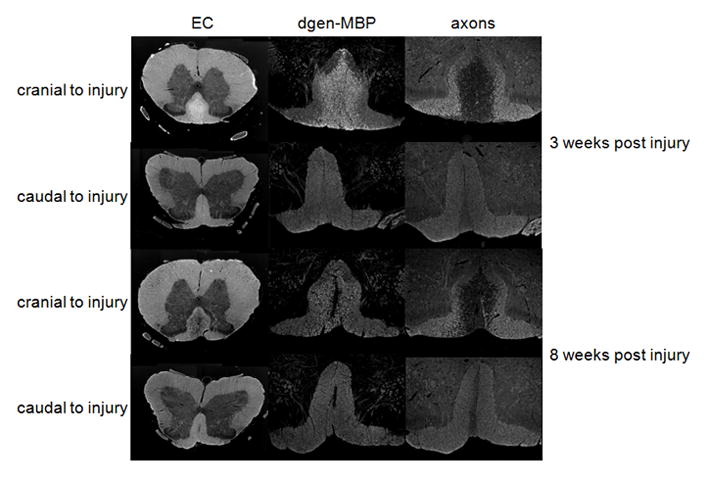
Figure 2.


(a) The first echoes of the CPMG data acquired in vivo at baseline (left) and at 3 weeks (middle) and 8 weeks (right) post injury and ex vivo. Shown are axial cross-sections acquired 5 mm cranial (top) and 5 mm caudal (bottom) to the injury site. Manually drawn ROIs encompassing the dorsal column are marked in green.
(b) Parametric maps calculated from the DTI data: fractional anisotropy (FA – left), longitudinal diffusivity (Dlong – middle) and transverse diffusivity (Dtrans – right) acquired ex vivo 5 mm cranial (top) and 5 mm caudal (bottom) to injury.
(c) Myelin stain (Eriochrome cyanine EC – left), degenerated myelin stain (dgen-MBP – middle) and axonal stain (right) from spinal cords excised 3 weeks (top two rows) and 8 weeks (bottom two rows) post injury. Only dorsal column (DC) is shown for the dgen-MBP and axonal stains. Notice increased EC staining in the dorsal column at 3 weeks post-injury on the cranial side due to large amount of myelin debris, as confirmed by the increase in dgen-MBP stain. Myelin debris are largely cleared at 8 weeks post-injury, as confirmed by the dgen-MBP stain, and significant demyelination is confirmed by the lower optical density of the EC stain.
