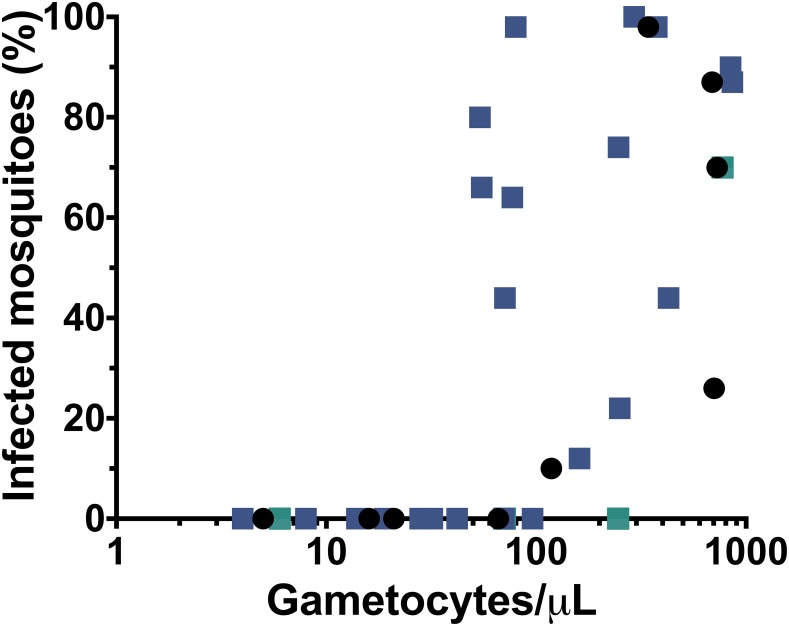
Fig 4. Relationship of microscopic gametocytemia to prevalence of mosquito infection.
The results of 35 membrane feeding assays performed on gametocytemic blood from 14 subjects pre and post-treatment. Black circles denote assays performed pre-treatment (Day 0), while colored squares denote assays performed post-treatment (Days 3, 7, 14) on subjects in the DHP-only group (indigo) and subjects in the DHP+PQ group (green). Additionally, the only two mosquito infections observed to arise from submicroscopic gametocytemia (pre-treatment) are depicted on the y-axis. Raw data for infected mosquitoes is available in Table 3. Note pre-treatment data (black circles) were previously presented in Ref 18.

