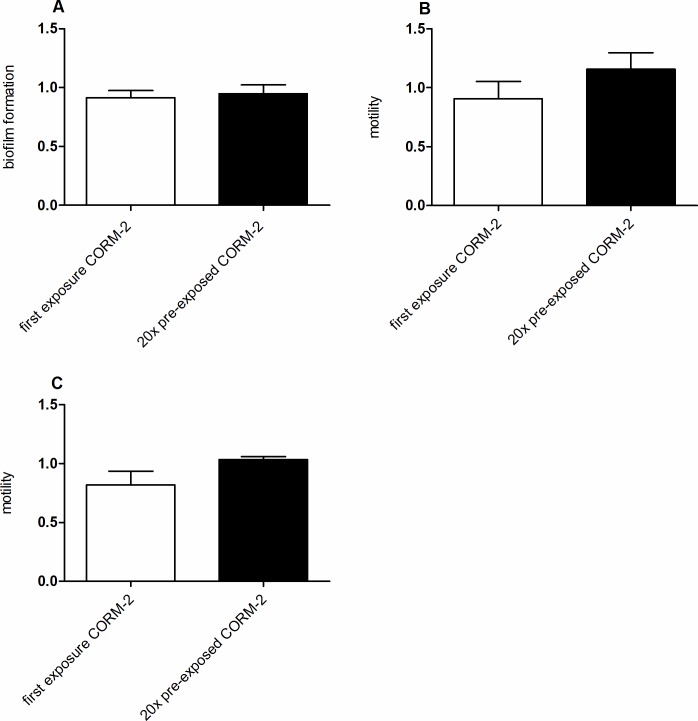
Fig 5. The phenotypic effect of CORM-2 on biofilm formation and motility in ESBL isolate 7.
A) Biofilm formation measured after first-time exposure to CORM-2 and after pre-exposure 20 times to CORM-2 (250 μM). The biofilm formation is presented as relative changes compared to the formation evoked by the vehicle (2.5% DMSO). Motility measured on B) swimming plates and C) swarming plates after first-time exposure and after pre-exposure 20 times to CORM-2 (250 μM) or vehicle (2.5% DMSO). The motility data are presented as relative changes compared to the motility evoked by the vehicle (2.5% DMSO). Data are shown as mean ± SEM from three independent experiments.

