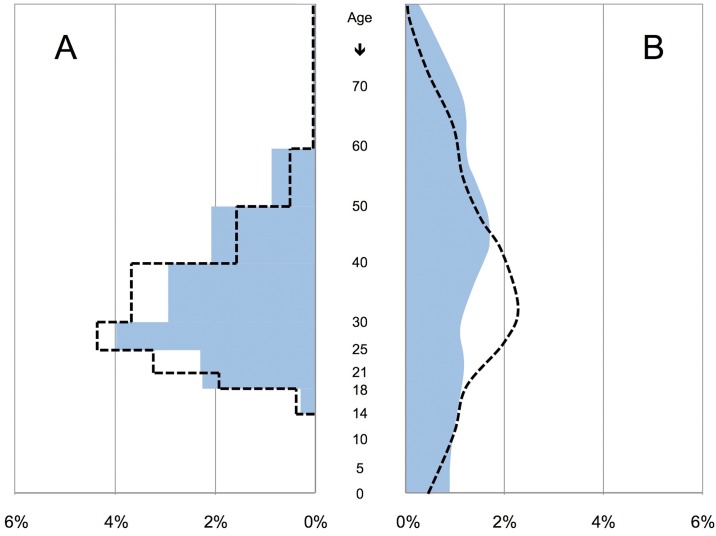
Fig 1. Age distribution of German and non-German citizenship.
Distribution of the prison population (A) and the general population (B) stratified by German (blue) and non-German (black dashed line) citizenship. For all four populations, the total population size was defined as 100%. In the prison population, life years were given in age intervals, producing a staircase shaped graph. Data representing the general population were given for each age year.

