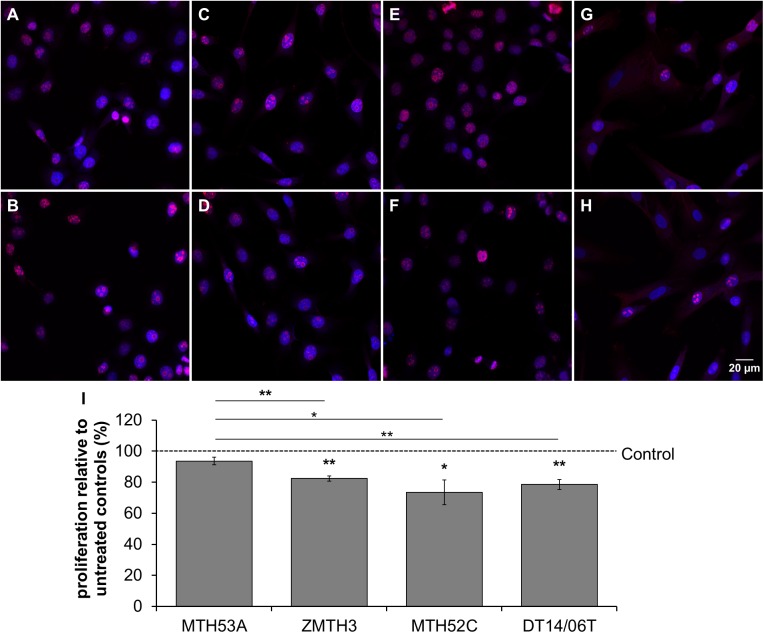
Fig 2. Impact of 10 mM DCA on proliferation of mammary cell lines after 48 hours determined with fluorescence microscopy.
(A-H) Images showing fluorescence of Ki67 (red) and DAPI (blue). In comparison to non-treated control (A,C,E,G) amount of Ki67 is reduced in all DCA treated cell lines (B,D,F,H) except in MTH53A (B). Statistical significant reduction of Ki67 was observed in ZMTH3, MTH52C and DT14/06T in comparison to non-treated control and non-neoplastic tissue derived cell line MTH53A. No significant decrease in proliferation could be determined in within neoplastic cell lines (I). Data are shown as mean ± SD, n≥3 and are presented as relative proliferation in comparison to untreated control (%). Control was set to 100%. Statistical analysis was performed with two-tailed t-test; *p<0.05, **p<0.01, ***p<0.001. (A) MTH53A control; (B) MTH53A+DCA; (C) ZMTH3 control; (D) ZMTH3+DCA; (E) MTH52C control; (F) MTH52C+DCA; (G) DT14/06T control; (H) DT14/06T+DCA; (I) relative proliferation.

