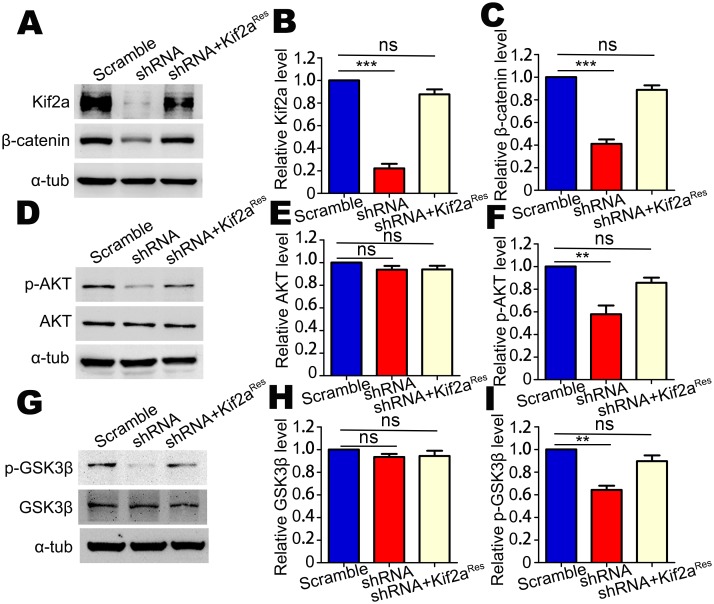
Fig 6. The expression of β-catenin, GSK3β, p-GSK3β, AKT, and p-AKT in NSCs/NPCs after Kif2a knockdown.
(A) Western blot analysis of the Kif2a and β-catenin levels in lysates of NSCs transfected with indicated plasmids (scramble shRNA, Kif2a shRNA or Kif2a shRNA+Kif2aRes). (B-C) Quantitative analysis of the Western blot data in A. n = 3 per group. ***P < 0.001; ns = no significant difference; one-way ANOVA followed by Bonferroni post-hoc test. Data are presented as the mean ± SEM. (D) Western blot analysis of the AKT and p-AKT levels in lysates of NSCs transfected with indicated plasmids (scramble shRNA, Kif2a shRNA or Kif2a shRNA+Kif2aRes). (E-F) Quantitative analysis of the Western blot data in D. n = 3 per group. **P < 0.01; ns = no significant difference; one-way ANOVA followed by Bonferroni post-hoc test. Data are presented as the mean ± SEM. (G) Western blot analysis of the GSK3β and p-GSK3β levels in lysates of NSCs transfected with indicated plasmids (scramble shRNA, Kif2a shRNA or Kif2a shRNA+Kif2aRes). (H-I) Quantitative analysis of the Western blot data in G. n = 3 for each. **P < 0.01; ns = no significant difference; one-way ANOVA followed by Bonferroni post-hoc test. Data are presented as the mean ± SEM.

