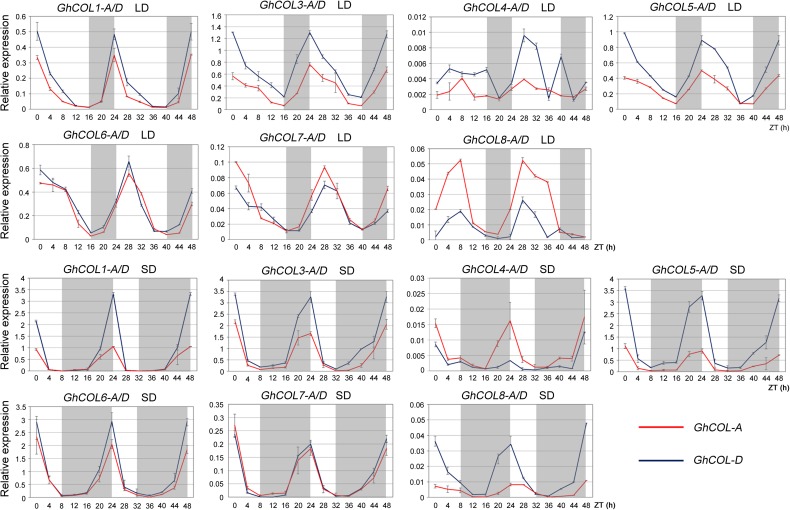
Fig 5. Diurnal expression pattern of the seven homoeologous COL gene pairs form Group I under LD or SD conditions.
Sample collection started at the beginning of the light period at zeitgeber time (ZT) 0 and continued every 4 h for 48 h in LD and SD conditions. The x-axis shows the time points and y-axis represents relative gene expression against cotton UBQ7 (DQ116441) as the control. Gray boxes over each chart indicate night. Data represent the mean ± SE obtained from three independent biological repeats.

