
Figure 10.
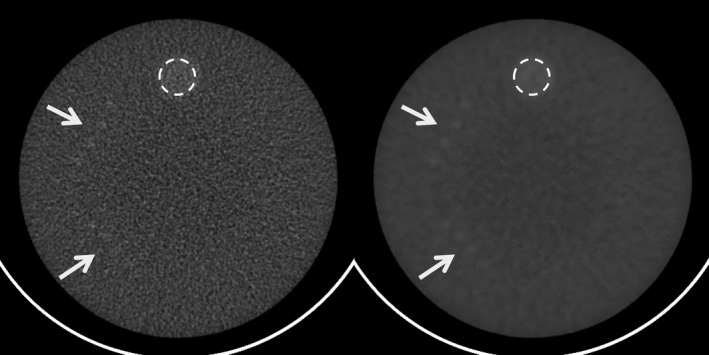
Improved low‐contrast resolution after MENLM filtering (right) comparing to the FBP image (left). Arrows indicate the locations of low‐contrast objects (top: 6 mm rods; Bottom: 5 mm rods). The mean and standard deviation of CT numbers inside the dotted ROI were 99.3 ± 5.5 (left) and 98.6 ± 1.0 HU (right), respectively. W/L = 100/100 HU.