
Figure 2.
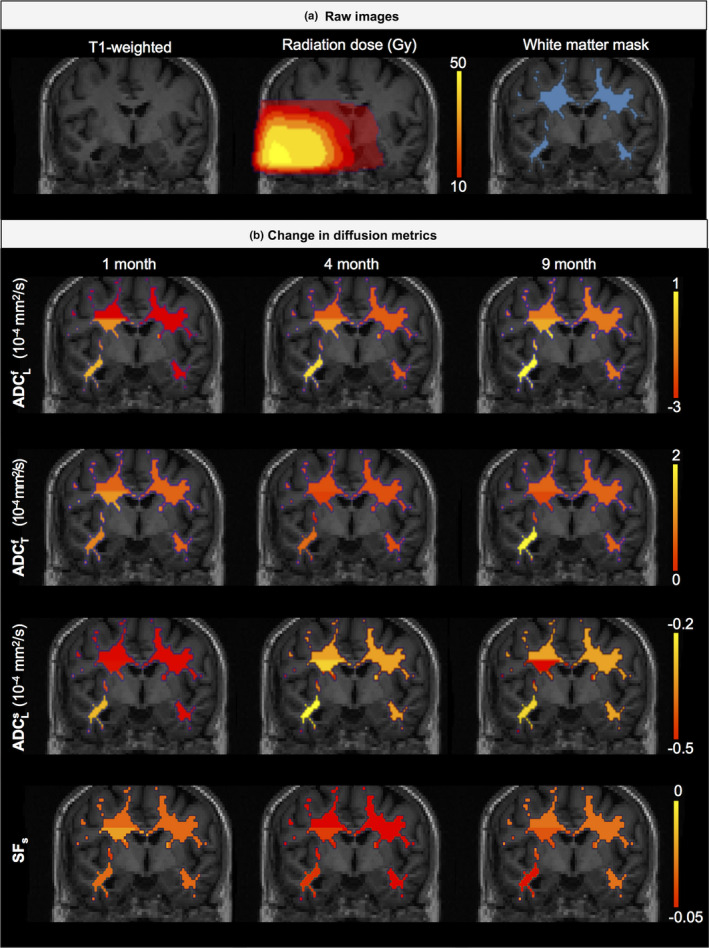
Example of T1‐weighted, radiation dose distribution, white matter mask, and maps of changes in diffusion metrics in a patient. [Color figure can be viewed at wileyonlinelibrary.com]
Official websites use .gov
A
.gov website belongs to an official
government organization in the United States.
Secure .gov websites use HTTPS
A lock (
) or https:// means you've safely
connected to the .gov website. Share sensitive
information only on official, secure websites.
Example of T1‐weighted, radiation dose distribution, white matter mask, and maps of changes in diffusion metrics in a patient. [Color figure can be viewed at wileyonlinelibrary.com]