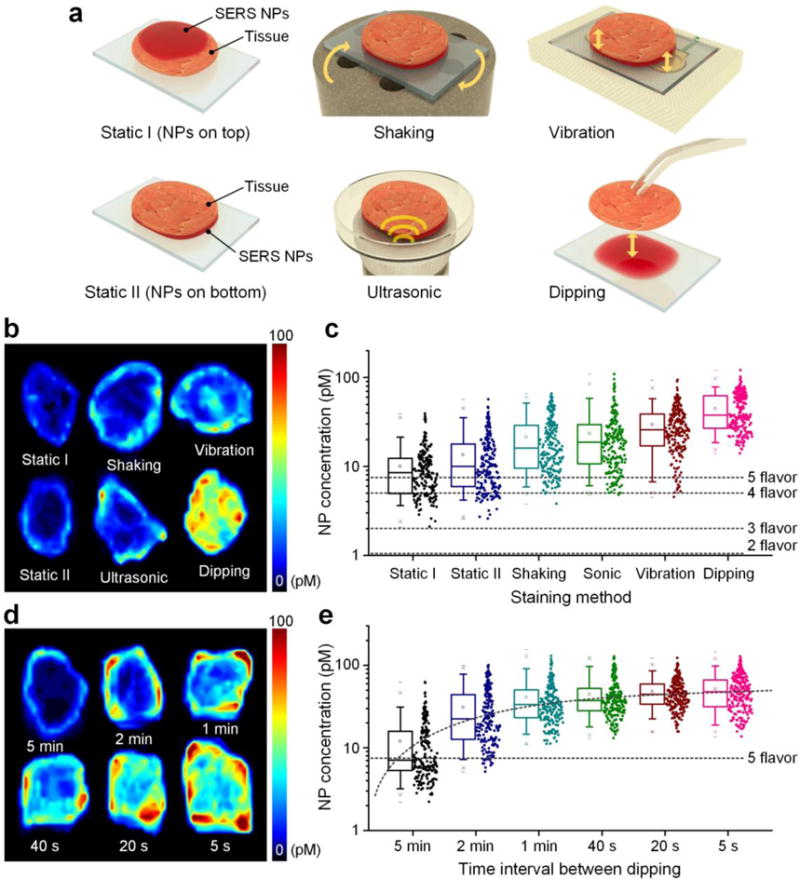
Figure 1.

Comparison and optimization of methods to enhance the effectiveness of topical staining of fresh tissues with SERS NPs. Rat muscle tissues were topically stained for 10 min using a variety of methods, followed by a 10-s rinse in PBS and raster-scanned imaging of the NPs that remain at the tissue surface. a) Illustration of six staining methods, including staining the tissue surfaces from the top (Static I), staining from the bottom (Static II), low-frequency shaking with a vortex mixer (Shaking), ultrasonic vibration (Sonic), high-frequency (267 Hz) vibration, and low-frequency (once per 20 s) dipping of the tissue into and out of a NP-staining solution. (b, c) Comparison of NP concentrations from tissues that were stained using the six different methods: b) representative images of NP concentrations, and c) box plots of NP concentrations (n = 3 tissues, log scale) from the experiments shown in (a). The horizontal dashed lines in (c) indicate the detection limits of our spectral imaging system (at a pixel rate of 10 Hz), when 2 to 5 NP flavors are multiplexed (Figure S2, Supporting Information). d) Representative images and e) box plots (n = 3 tissues, log scale) of measured NP concentrations from tissues stained via dipping into and out of a staining solution at different frequencies.
