Figure 3.

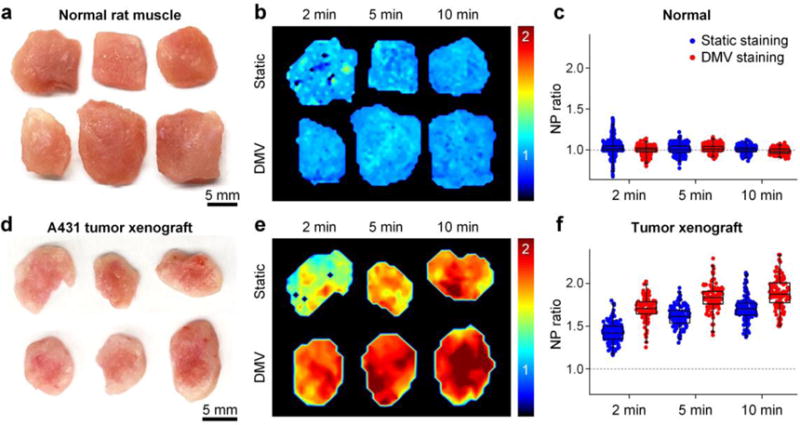
Comparison of static staining and DMV staining. Each tissue specimen was stained with a 2-flavor NP mixture (EGFR-NPs and isotype-NPs, 150 pM/flavor) for 2, 5 or 10 min through static staining or DMV staining, followed by a 10-s rinse in PBS and then raster-scanned imaging. a,d) Photographs of resected normal rat muscle (a) and A431 tumor xenograft specimens (d). b,e) Images showing the concentration ratio of EGFR-NPs vs. isotype-NPs on normal muscle (b) and tumor xenografts (e). c,f) Box plots of the NP ratio (targeted vs. untargeted) from three sets of experiments.
