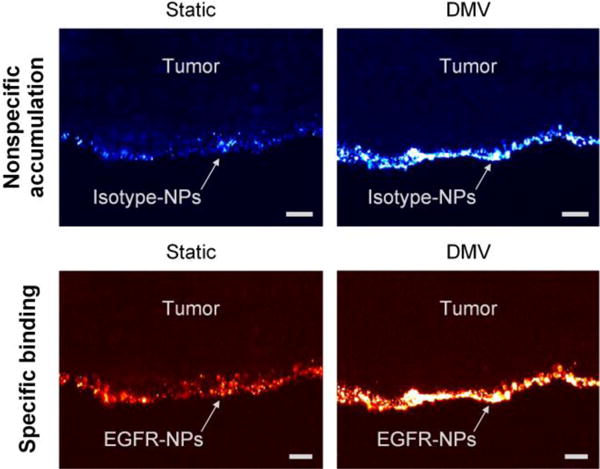
Figure 4.

Fluorescence microscope image of a frozen section (10-μm tissue cross section) showing the penetration of SERS NPs near the surface of an A431 tumor. The specimen was topically stained with a mixture of EGFR-NPs and isotype-NPs (150 pM/flavor, 10 min) using either the static or DMV method. The images show that topically applied SERS NPs are localized to the tissue surface with a limited penetration depth of 10–20 μm. The scale bars represent 20 μm.
