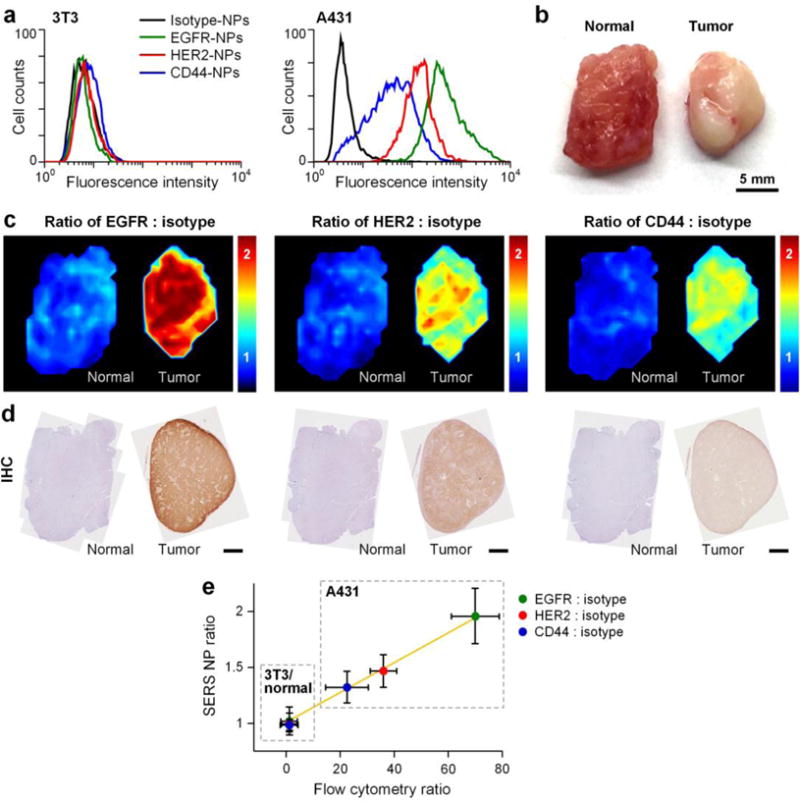
Figure 5.

Multiplexed molecular imaging of a A431 tumor xenograft through automated DMV staining with a 4-flavor NP mixture (EGFR-NPs, HER2-NPs, CD44-NPs and isotype-NPs). a) Flow cytometry validation of conjugated NPs with cultured cells. EGFR-NPs, HER2-NPs, CD44-NPs and isotype-NPs were individually used to stain 3T3 (control) and A431 (cancer) cell lines. Fluorescence histograms from NP-stained cells are shown. b) Photograph of a resected normal rat muscle specimen and a A431 tumor xenograft. c) Ratiometric images of EGFR-NPs vs. isotype-NPs, HER2-NPs vs. isotype-NPs and CD44-NPs vs. isotype-NPs. d) Validation data: IHC for EGFR, HER2 and CD44. Unlabeled scale bars represent 2 mm. e) Plots showing the correlation between the NP ratios (targeted NP vs. untargeted NP) measured with REMI of xenograft tumors (in c) and the corresponding NP ratios measured via flow cytometry of NP-stained cells (in a). The NP ratios are the average and standard deviation from the REMI images of the tissues shown in (c). R > 0.98.
