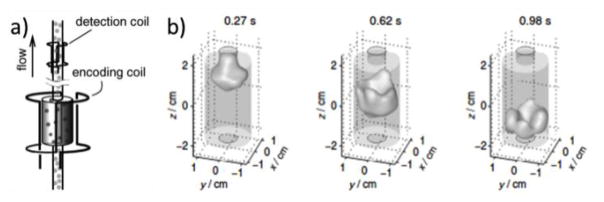
Figure 14.
RD MRI of flow of HP 129Xe through a rock sample. (a) The rock sample is inside a large RF coil used to encode spatial information into spin coherences, and the signal is read out by a smaller and more sensitive coil around the outlet tubing, with optimized filling factor. (b) 3D TOF images. The silhouettes represent the rock sample. TOF, i.e., the time instant the signal is detected after the encoding, is shown above the images. Reprinted with permission from Granwehr, J.; Harel, E.; Han, S.; Garcia, S.; Pines, A.; Sen, P. N.; Song, Y. Q. Phys. Rev. Lett. 95, 075503 (2005). Copyright (2005) by the American Physical Society.

