
Figure 17.
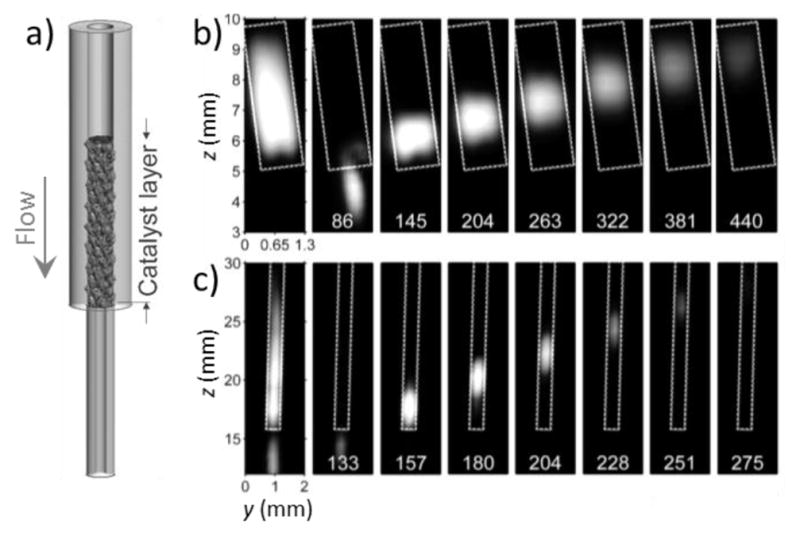
RD MRI visualization of reaction progress inside a catalyst layer packed in a thin capillary. (a) Sample setup. 2D TOF images of HP propane resulting from the hydrogenation reaction in the reactors of (a) 800 and (b) 150 μm in diameter. The reactors are outlined by a white dashed line in the figures. TOF (ms) is shown at the bottom of the panels. The panels on the left are the sums of all other panels in each series.[231c]