
Figure 3.
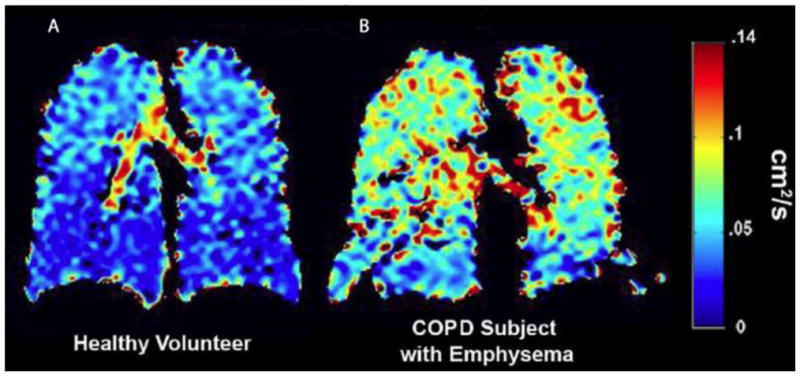
ADC map of a healthy volunteer and a patient with COPD. a) Healthy volunteer with a low mean ADC of 0.037±0.021 cm2/s, indicating normal alveolar microstructure. b) Patient with COPD with high ADC values (0.068±0.028 cm2/s) in the parenchyma, indicating alveolar destruction. Reproduced with permission from Ref. [96] © John Wiley & Sons, Ltd., 2011.