
Figure 5.
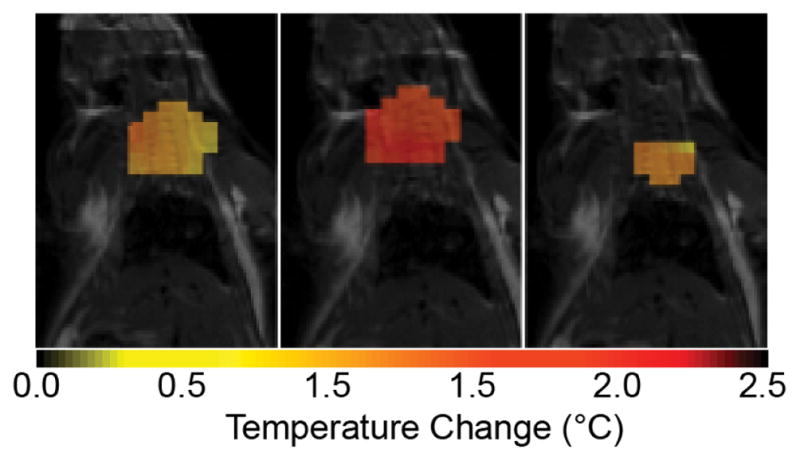
129Xe brown adipose tissue (BAT) temperature map overlaid on a sagittal 1H image. These temperature maps were obtained by using the lipid-dissolved xenon signal as a temperature probe. The temperature coefficient of the lipid-dissolved xenon chemical shift was measured to be −0.2 ppm/°C.