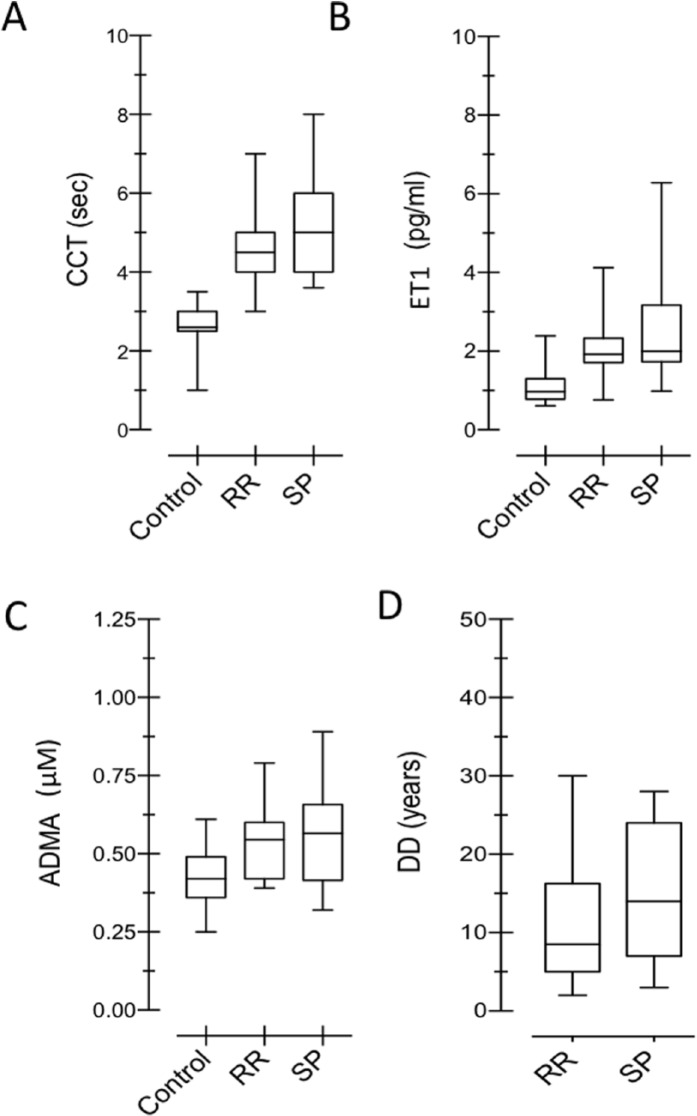
Figure 1.
(A–D) Box-plot analysis of mean values of CCT, ET1, ADMA, and DD among controls and MS subgroups (RR and SP). The figure represents the distribution of CCT measured in seconds in controls and in RR-MS and SP-MS patients. The control group showed significantly lower CCT. (A) The difference of the CCT mean between MS subgroups is statistically significant (P = .0215): CCT values in SP were significantly higher than in RR subgroup. (B) Distribution of the ET1 titration is statistically different between controls and patients with MS (F = 28.8, P < .0001), whereas the Holm-Šidak post hoc test specified that there was no significant difference between RR and SP patients (P = .5729). (C) ADMA titration is significantly different between controls and patients with MS (mean 0.4224 ± 0.09 SD; F = 11.95, P < .0001), but is not significantly different (P = .6671) between the MS forms (RR mean 0.5343 ± 0.09 SD; SP mean 0.5500 ± 1.15 SD). (D) No significant difference has been demonstrated between RR-MS and SP-MS patients when DD is considered (t = 1.234, P = .222). ADMA indicates asymmetric dimethylarginine; CCT, cerebral circulation time; ET1, endothelin-1; MS, multiple sclerosis; RR, relapsing-remitting; SP, secondary-progressive.

