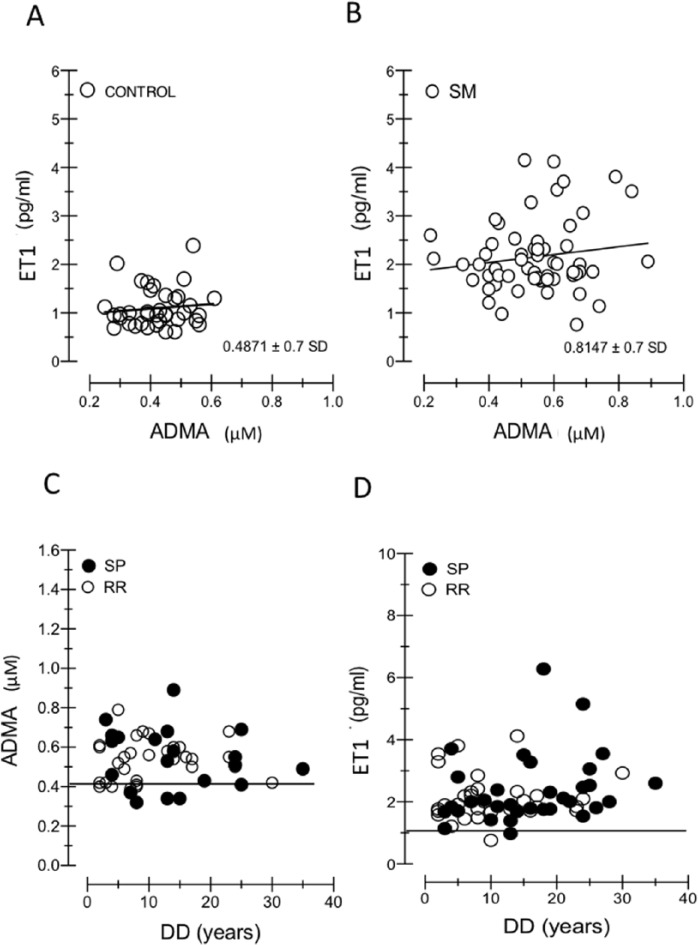
Figure 2.
(A–D) Correlation analysis of evaluated biological parameters in MS and controls. In (A) and (B), correlation between ET1 and ADMA in C and MS groups: no significant correlations are demonstrated between ADMA and ET1 in both groups (MS and control). Note that the slope of fitting lines for ADMA and ET1 remained about the same in C and MS subjects. In (C) and (D), correlation between DD and ADMA, DD, and ET1: DD is not significantly correlated with these vasoactive factors. Different cohorts of patients have been highlighted: RR-MS (°) and SP-MS (•). ET1 and ADMA normal line value has been introduced and time (years) in x-axis has been set. Note that there is no difference between 2 MS subgroups over time. If the higher values of ET1 and ADMA were the late expression of disease, we should have demonstrated increasing values over the course of the disease. ADMA indicates asymmetric dimethylarginine; DD, disease duration; ET1, endothelin-1; LL, lesion load; MS, multiple sclerosis; RR, relapsing-remitting; SP-MS, secondary-progressive.

