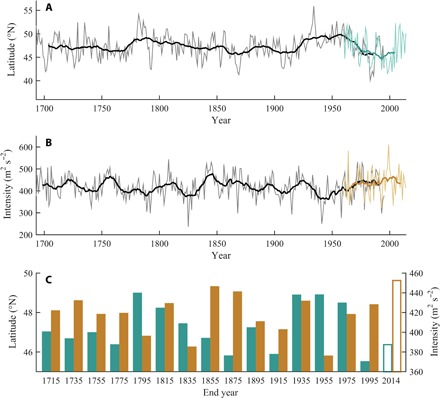
Fig. 2. Reconstruction of cool-season storm-track position from 1693 to 1995 CE.

(A) Cool-season (October to March) observed (thin green) and reconstructed (thin gray) storm-track latitude at 124°W longitude with a 22-year moving average (thick green and black) to highlight longer-term variability at an important frequency band. (B) Cool-season (October to March) observed (thin brown) and reconstructed (thin gray) storm-track intensity at 124°W longitude with a 12-year moving average (thick brown and black) to highlight longer-term variability at an important frequency band. (C) Storm-track latitude (solid green) and intensity (solid brown) averaged over 20-year periods throughout the reconstruction. The final 19-year period (green and brown outlines) is based on instrumental, rather than reconstructed, data.
