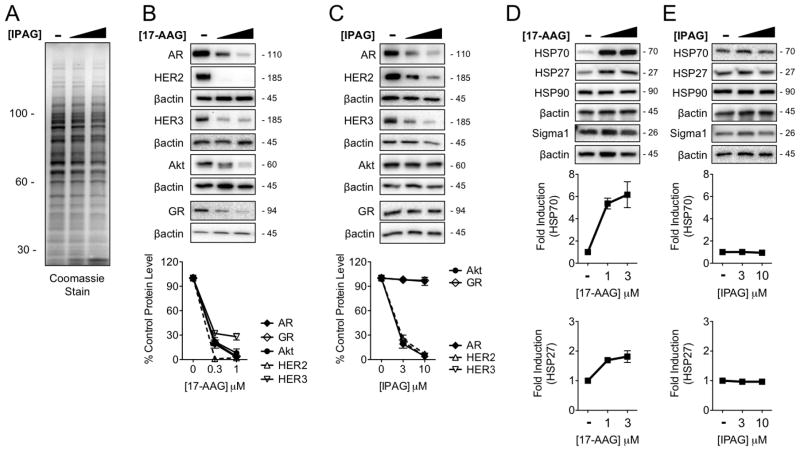
Figure 4. Selectivity of Sigma1 inhibitor induced protein degradation in comparison with HSP90 inhibitor.
(A) Coomassie stain of SDS-PAGE resolved whole cell lysates from LNCaP cells treated for 16 hours with DMSO (−) or increasing concentrations of IPAG (3, 10 μM). (B–C) Immunoblot of HSP90 client proteins from LNCaP cells treated for 16 hours with DMSO (−) or increasing concentrations of 17-AAG (0.3, 1 μM) (B) or IPAG (3, 10 μM) (C). The GR immunoblots are of whole cell lysates from VCaP cells. (D–E) Immunoblot showing induction of HSP70 and HSP27 in response to treatment with 17-AAG (1, 3 μM) (D), and absence of HSP70 and HSP27 induction in response to treatment with IPAG (3, 10 μM) (E). All data represent mean ± S.E.M. and are generated from at least 3 independent determinations.

