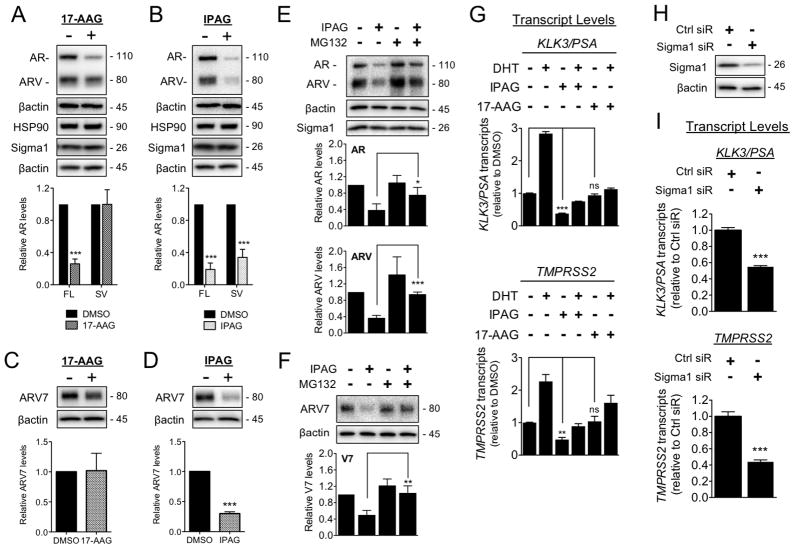
Figure 5. Sigma1 inhibitor mediated degradation of AR and ARV and suppression of AR and ARV driven transcription in comparison with HSP90 inhibitor.
(A–F) Treatment with IPAG induces proteasomal degradation of full-length and splice variant AR. (A–B) Immunoblot and densitometry of full-length AR (FL) and ARV (SV) from whole cell lysates of 22Rv1 cells treated for 16 hours with 17-AAG (3 μM) (A) or IPAG (10 μM) (B). Quantifications of immunoblots by densitometry are shown below each immunoblot panel. (C–D) Immunoblots and densitometric quantification of ARV7 in 22Rv1 cells treated for 16 hours with 17-AAG (3 μM) (C) or IPAG (10 μM) (D). (E–F) Representative immunoblots of AR and ARV protein levels (E) and ARV7 (F) in whole cell lysates from 22Rv1 cells co-treated for 8 hours with 10 μM IPAG and 1 μM MG132. Bands were quantified by densitometry and data are presented as levels of AR, ARV, or ARV7 relative to DMSO treated control. (G) Detection of KLK3/PSA and TMPRSS2 mRNA transcript levels by qRT-PCR from 22Rv1 cells grown in CSS for 5 days, then subjected to 16 hour treatment with 10 μM IPAG or 3 μM 17-AAG combined with 1 nM DHT. (H) Immunoblot confirming siRNA knockdown of Sigma1 in 22Rv1 cells from which RNA was isolated and evaluated in (I). (I) Detection of KLK3/PSA and TMPRSS2 mRNA transcript levels by qRT-PCR from CSS medium cultured 22Rv1 cells in which Sigma1 was knocked down. Bars represent mean ± S.E.M. and are generated from at least three independent determinations. *P < 0.05; **P < 0.01; ***P < 0.001.

