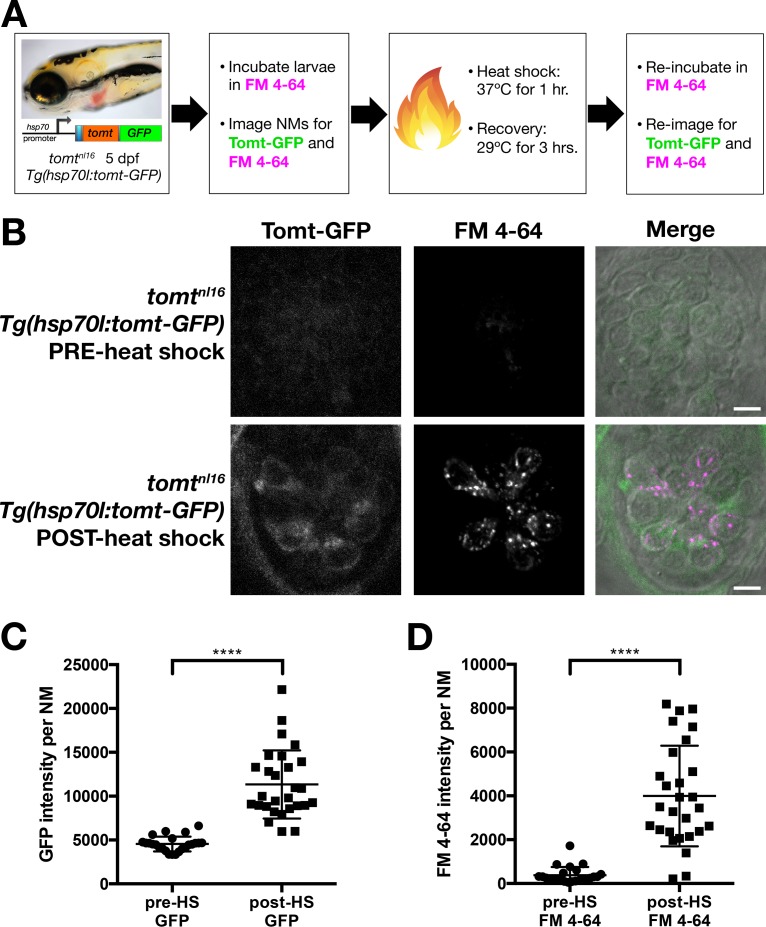
Figure 6. Restoration of MET channel activity in mercury mutant hair cells with heat shock-inducible Tomt-GFP.
(A) Workflow for the heat-shock inducible tomt-GFP transgene experiment. (B) Representative images of Tomt-GFP (left panels), FM 4–64 (middle panels) and merged GFP, FM 4–64 and DIC channels (right panels) in lateral line NMs of 5 dpf Tg(hsp70l:tomt-GFP); tomtnl16 larvae pre- and post-heat shock. (C, D) Quantification of GFP intensity (C) and FM 4–64 intensity (D) per NM of Tg(hsp70l:tomt-GFP); tomtnl16 larvae (n = 6) pre- and post-heat shock. Error bars are the mean ± SD. Asterisks indicate p<0.0001 by unpaired, two-tailed t-test. Scale bars: 5 µm in B.

