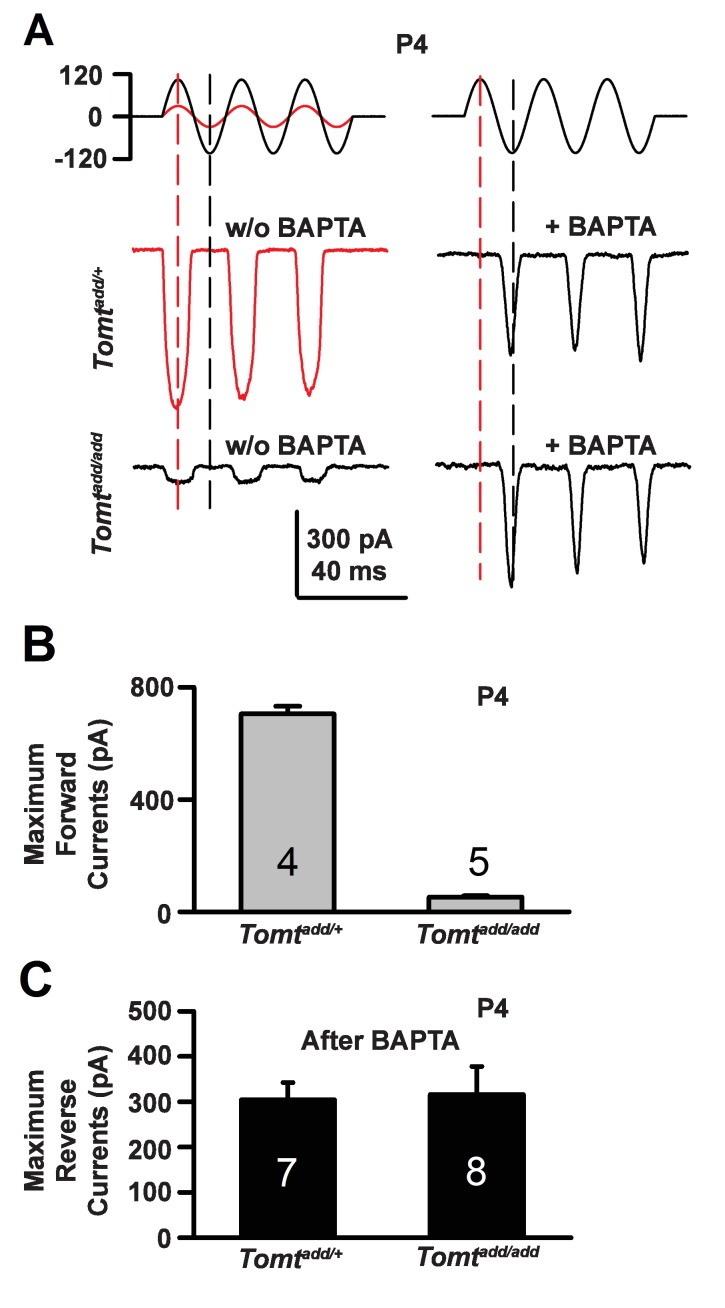
Figure 9. Forward and reverse polarity currents in Tomt mutants.
(A) Representative mechanotransduction currents in response to sinusoidal deflection of hair bundles at P4 for OHCs from Tomtadd/+ and Tomtadd/add mice with and without 5 mM BAPTA treatment. All recordings were from middle or apical OHCs at a holding potential of −70 mV. The stimulus monitor (the driving voltage to the fluid jet) is shown at the top. A lower voltage (red trace) was necessary to obtain similar displacements in Tomtadd/+ mice relative to Tomtadd/add mice (black trace). Positive driving voltage denotes displacement toward the tallest edge of the hair bundle. (B) Plot of maximum forward MET currents obtained from similar data as A. Number of cells for each condition is indicated on graph. (C) Plot of maximum reverse currents obtained from similar data as in (A). Number of cells for each condition is indicated on graph.

