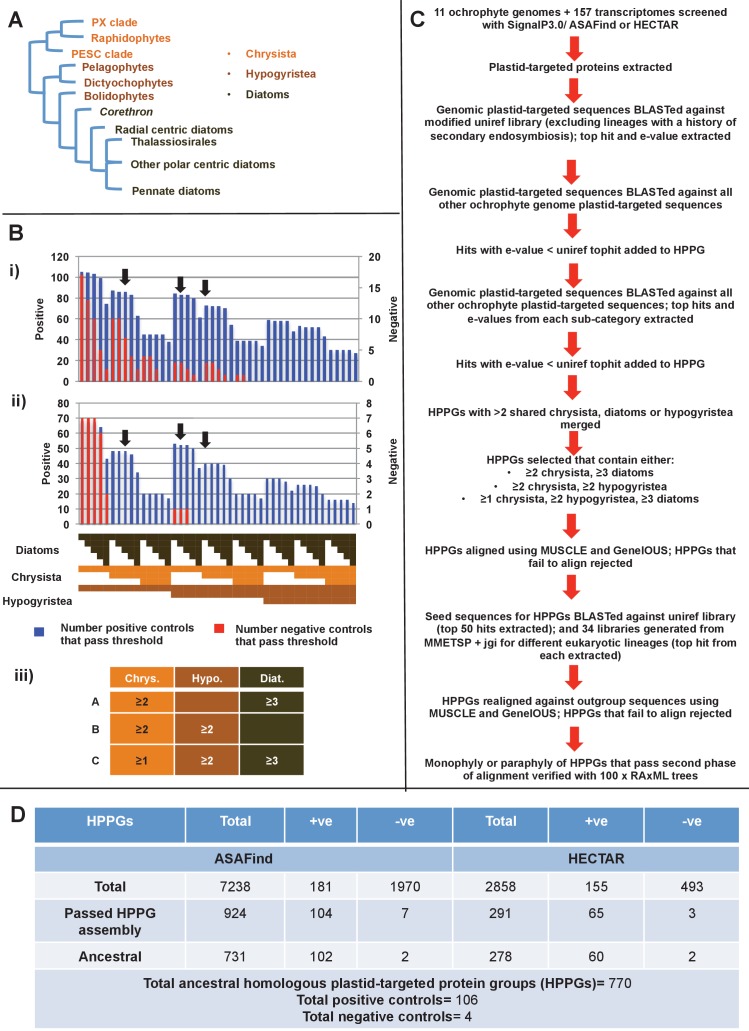
Figure 1. Procedure for identification of conserved plastid-targeted proteins in ochrophytes.
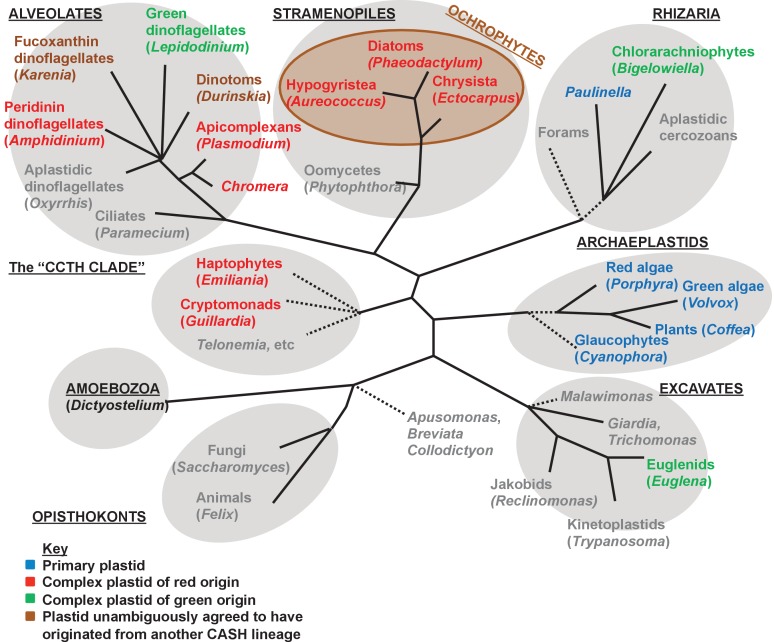
(Panel A) shows a schematic unrooted ochrophyte tree, with the three major ochrophyte lineages (chrysista, hypogyristea, and diatoms) denoted by different coloured labels. ‘PX’ refers to the combined clade of phaeophytes, xanthophytes and related taxa, and ‘PESC’ to pinguiophytes, eustigmatophytes, synchromophytes, chrysophytes and relatives. A global overview of the eukaryotic tree of life, including the position of ochrophytes relative to other lineages is shown in Figure 1—figure supplement 1. (Panel B) shows the number of inferred positive control HPPGs (i.e., HPPGs encoding proteins with experimentally confirmed plastid localisation, or unambiguously plastid function) and negative control HPPGs (i.e., HPPGs encoding proteins with no obvious plastid-targeted orthologues encoded in ochrophyte genomes, but found in haptophyte and cryptomonad genomes) detected as plastid-targeted in different numbers of ochrophyte lineages using ASAFind (i) and HECTAR (ii). The blue bars show the number of positive controls identified to pass a specific conservation threshold, plotted against the left hand vertical axis of the graph, while the red bars show the number of negative controls that pass the same conservation threshold, plotted against the right hand vertical axis of the graph. The number of different sub-categories included in each conservation threshold is shown in a heatmap below the two graphs, with the specific distribution for each bar in the graph shown in the aligned cells directly beneath it. Each shaded cell corresponds to an identified orthologue in one sub-category of a particular ochrophyte lineage: orange cells indicate presence of chrysistan sub-categories; light brown cells the presence of hypogyristean sub-categories; and dark brown cells the presence of diatom sub-categories. In each graph, black arrows label the conservation thresholds inferred to give the strongest separation (as inferred by chi-squared P-value) between positive and negative control sequences. The table (iii) tabulates the three conservation patterns identified as appropriate for distinguishing probable ancestral HPPGs from false positives. (Panel C) shows the complete HPPG assembly, alignment and phylogenetic pathway used to identify conserved plastid-targeted proteins. (Panel D) tabulates the number of HPPGs built using ASAFind and HECTAR predictions, and the number of non-redundant HPPGs identified in the final dataset. The final total represents the pooled total of non-redundant HPPGs identified with both ASAFind and HECTAR.


