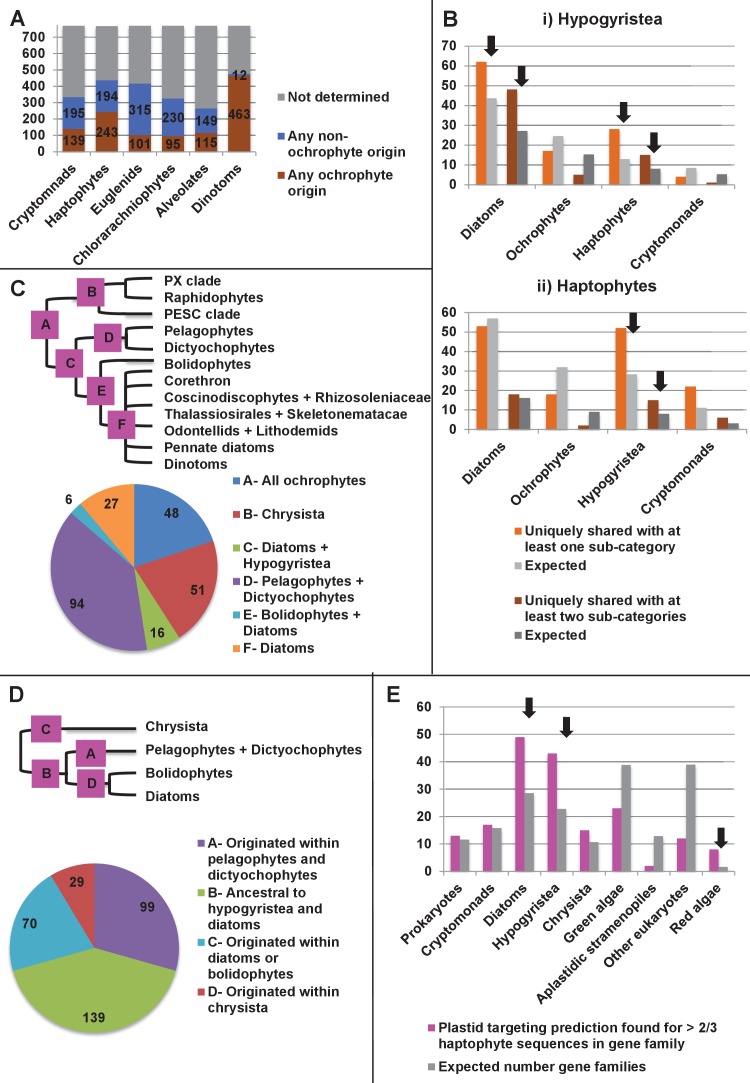
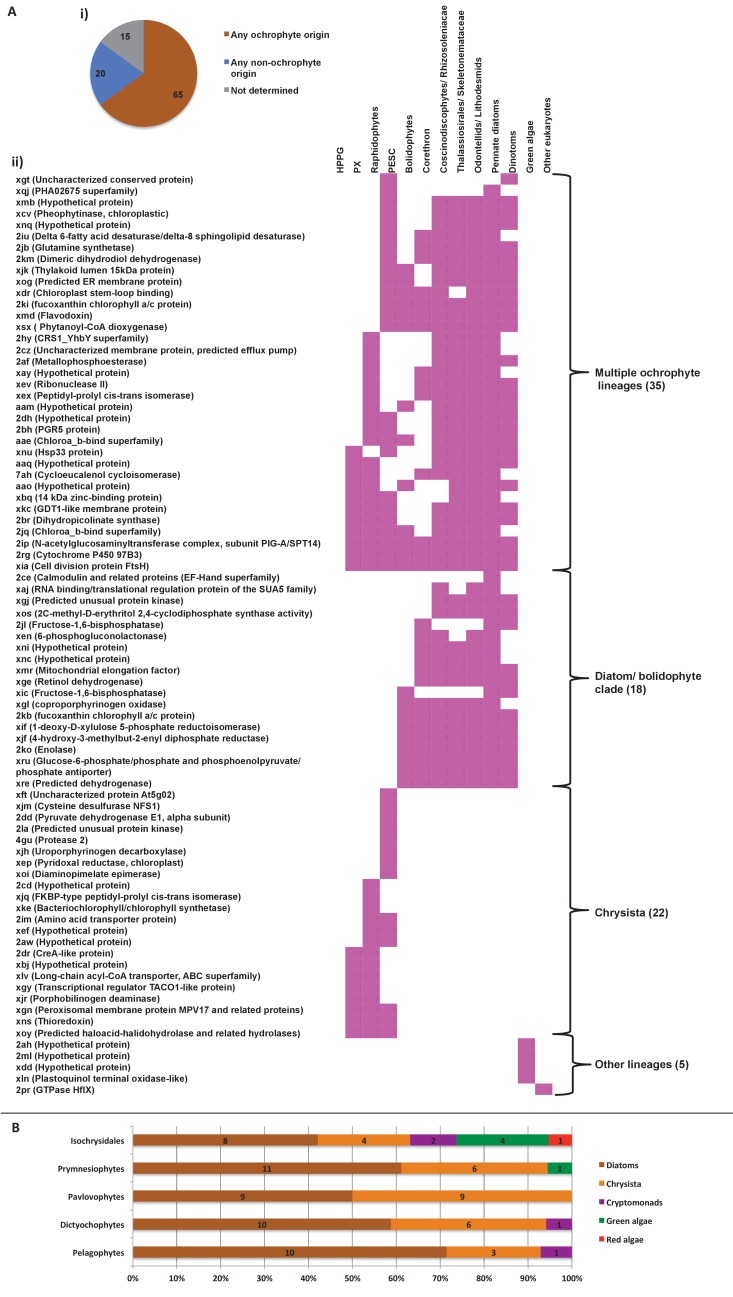
Figure 8. Footprints of an ancient endosymbiosis in the haptophyte plastid proteome.
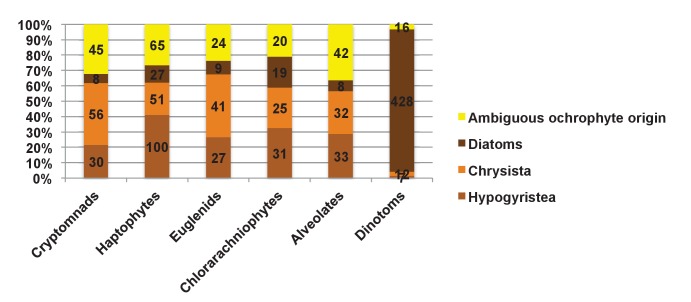
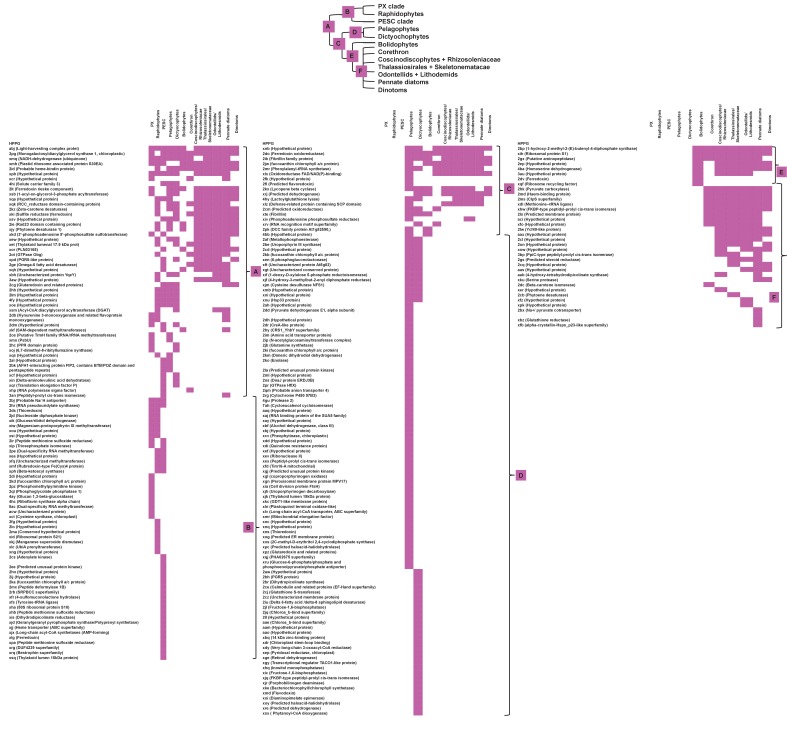
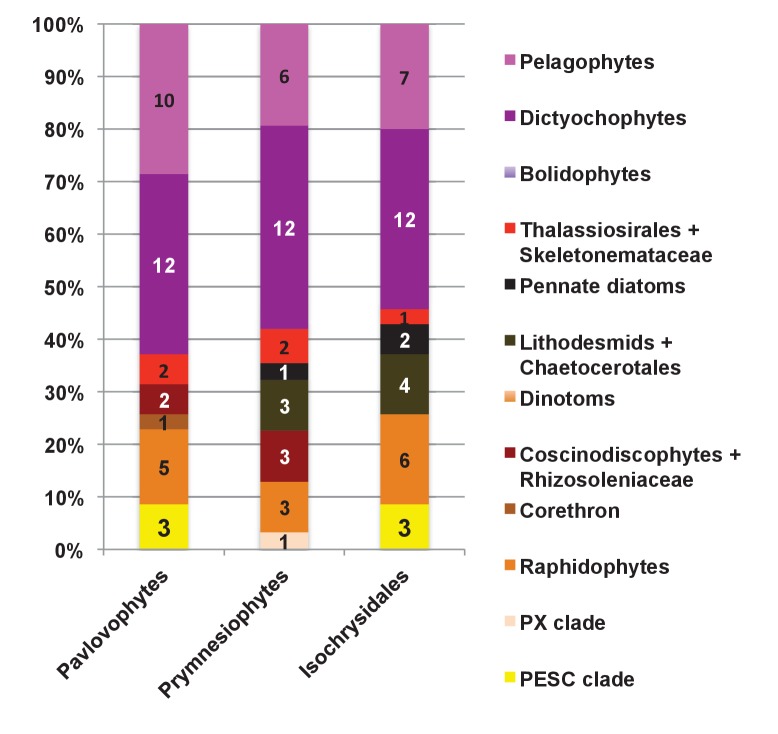
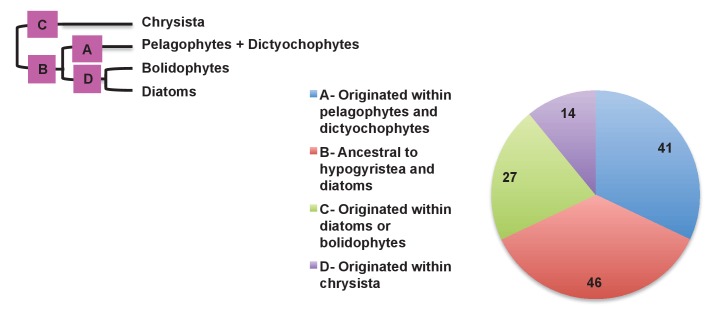
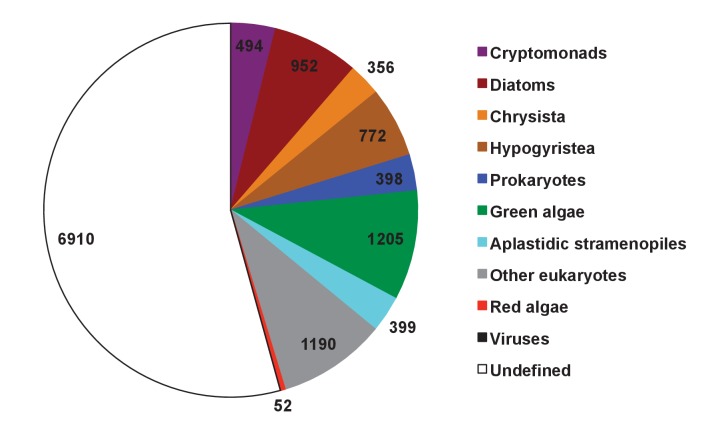
(Panel A) indicates the number of ancestral ochrophyte HPPGs that included sequences from other algal lineages in single-gene tree analyses, and whether those algal lineages branched within or external to ochrophytes. An overview of the specific origins of proteins of ochrophyte origin in each lineage is shown in Figure 8—figure supplement 1. (Panel B) compares the number of ASAFind-derived HPPGs that are uniquely shared between hypogyristea (i) or haptophytes (ii) and one other CASH lineage. Values are given for proteins found in a majority of sub-categories in hypogyristea/ haptophytes and at least one sub-category from only one other lineage (light bars), and proteins found in a majority of sub-categories in hypogyristea/ haptophytes and a majority of sub-categories from only one other lineage (dark bars). Values that are significantly greater than would be expected through random distribution are labelled with black arrows. (Panel C) shows a schematic ochrophyte tree, with six different ancestral nodes within this tree labelled with coloured boxes, and the most probable origin point for each of the 243 haptophyte plastid-targeted proteins of probable ochrophyte origin within this tree, as inferred by inspection of the nearest ochrophyte sister-group in single-gene trees. A detailed heatmap of the ochrophyte sub-categories contained in each lineage is shown in Figure 8—figure supplement 2, and BLAST top hit analyses corresponding to each plastid-targeted protein are shown in Figure 8—figure supplement 3. (Panel D) shows the number of residues that are uniquely shared between haptophytes and each node of the ochrophyte tree for 37 genes in which there has been a clear transfer from ochrophytes to haptophytes, and entirely vertical subsequent inheritance. A similar graph, showing the earliest possible inferred origin of each uniquely shared residue, is shown in Figure 8—figure supplement 4. (Panel E) shows the number of the 12728 conserved gene families inferred to have been present in the last common haptophyte ancestor that are predicted by ASAFind to encode proteins targeted to the plastid, subdivided by probable evolutionary origin, and the number expected to be present in each category assuming a random distribution of plastid-targeted proteins across the entire dataset, independent of evolutionary origin. Evolutionary categories of proteins found to be significantly more likely (chi-squared test, p=0.05) to encode plastid-targeted proteins than would be expected by random distribution are labelled with black arrows. The evolutionary origins of the ancestral gene families are shown in Figure 8—figure supplement 5.

