. 2017 May 12;6:e23717. doi: 10.7554/eLife.23717

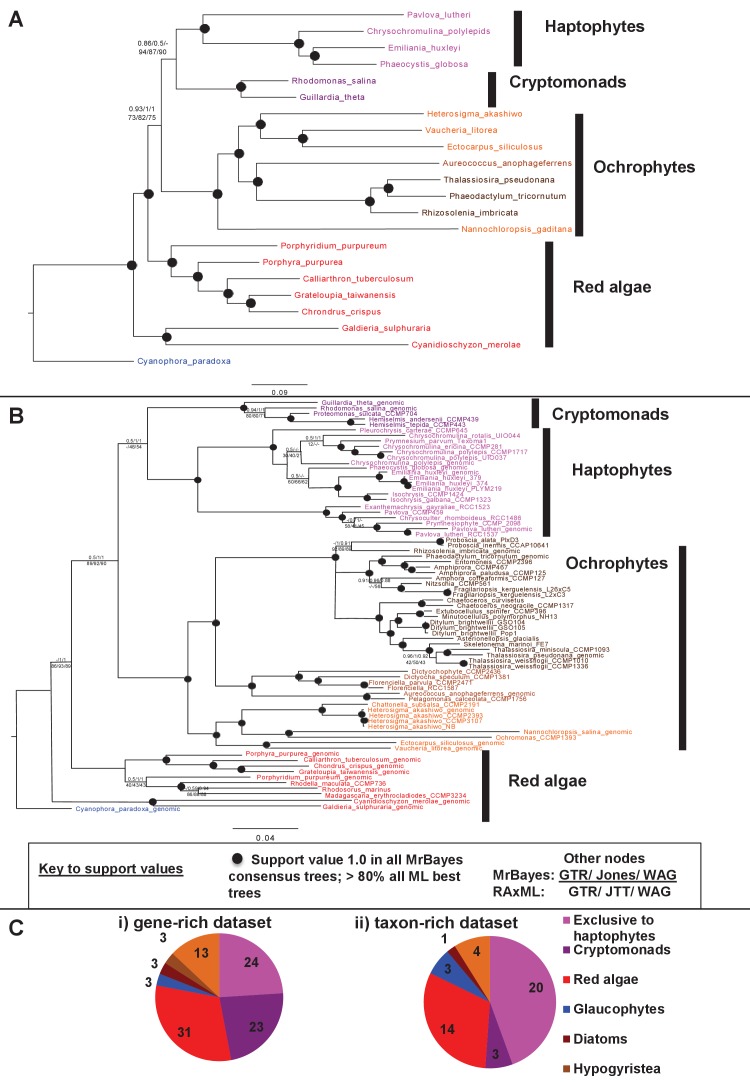
Figure 9. Non-ochrophyte origins of the haptophyte plastid genome.

(Panels A and B), respectively, show gene-rich and taxon-rich phylogenies of plastid-encoded proteins from red algae and plastids of red algal origin with the glaucophyte Cyanophora paradoxa as outgroup. (Panel A) Combined Bayesian and Maximum Likelihood analysis (MrBayes + RAxML, GTR, JTT, WAG) of a 22 taxa x 12103 aa alignment of 54 proteins encoded by all published red and red-derived plastid genomes. (Panel B) analysis of a 75 taxa x 3737 aa alignment of 10 conserved plastid-encoded proteins detectable in a broad range of red lineage MMETSP libraries. Nodes resolve with robust support (posterior probabilities of 1 for all Bayesian trees and >80% bootstrap support for all ML trees) are shown with filled circles; individual support values for each analysis are shown for the remaining nodes are shown as detailed in the box below panel B. Alternative topology tests, the results of fast-site and clade deduction analysis for each tree, and heatmap comparisons of sister-group relationships identified for single-gene trees of each constituent gene within each concatenated alignment are shown in Figure 9—figure supplements 13. (Panel C) shows the number of residues in each alignment that are uniquely shared between haptophytes and only one other lineage. For the gene-rich alignment (i), which is gap-free, residues are included that are found in all four haptophyte sequences and at least one sequence from the lineage under consideration. For the taxon-rich alignment (ii), to account for the presence of gapped positions, residues are included that are found in at least 11 of the 22 haptophyte sequences and at least one sequence from the lineage under consideration.

DOI: http://dx.doi.org/10.7554/eLife.23717.045

Figure 9.

Figure 9—figure supplement 1. Alternative topology tests of plastid genome trees.

Figure 9—figure supplement 1.

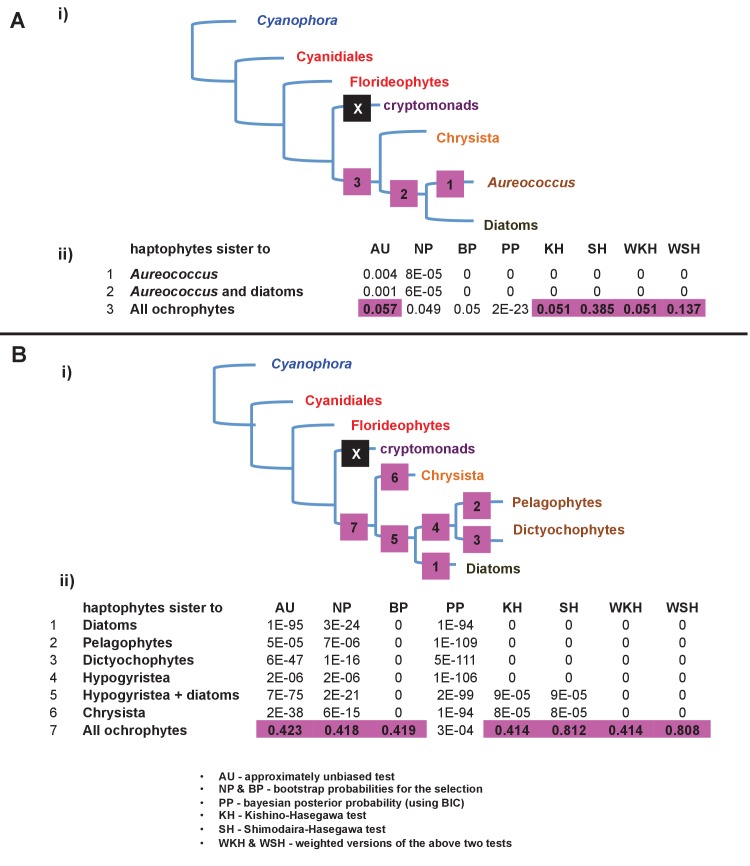
Tests were performed with the RAxML + JTT trees inferred for the gene-rich (panel A) and taxon-rich (panel B) plastid-encoded protein alignments. In each case, a schematic diagram of the tree topology obtained is given (i). The black box corresponds to the branch position of haptophytes in the consensus tree; alternative branching positions for the haptophyte sequences are labelled with numbered boxes. The table below (ii) lists the probabilities for each alternative position under eight different tests performed with CONSEL. Alternative positions that are not rejected by a topology test are shaded. All possible trees in which the haptophyte sequences branch within the ochrophytes are clearly rejected under all conditions, confirming that its plastid genome is of non-ochrophyte origin. The legend at the bottom of panel B gives full names for each test performed.
Figure 9—figure supplement 2. Fast site removal and clade deduction analysis of plastid genome trees.

Figure 9—figure supplement 2.

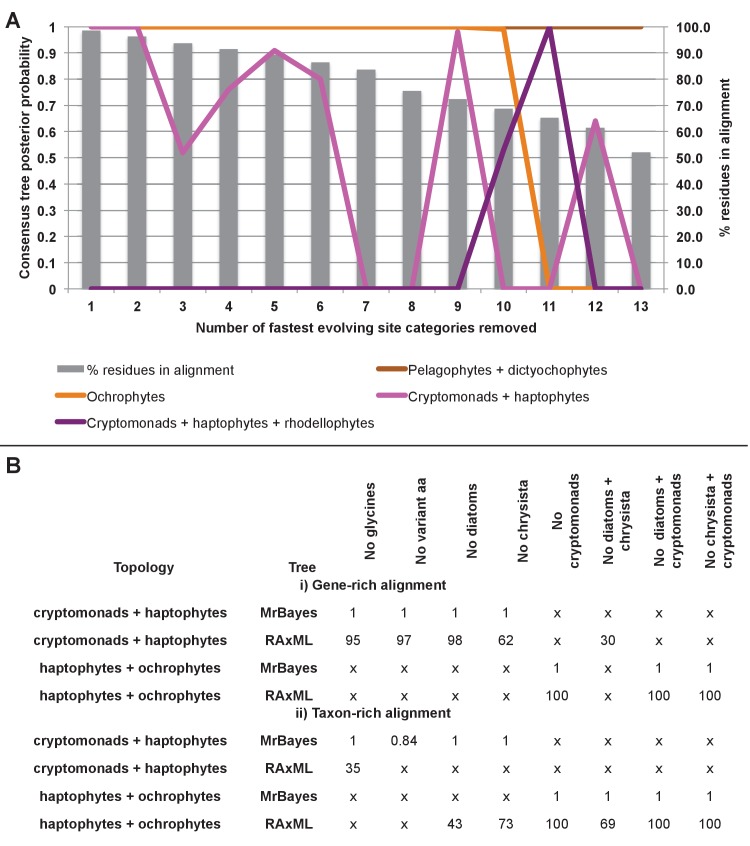
(Panel A) shows the support values obtained for Bayesian + Jones trees inferred from modified versions of the taxon-rich plastid multigene alignment from which the 13 fastest evolving site categories had been removed for four different branching relationships pertaining to the placements of haptophyte and hypogyristean sequences. The % of residues from the original alignment retained in each modified alignment are shown with grey bars. (Panel B) tabulates the support obtained for two different evolutionary relationships (haptophytes as a sister group to all cryptomonads, and as a sister group to all ochrophytes) in gene-rich (i) and taxon-rich (ii) alignments modified to remove all amino acids that occur at different frequencies in haptophytes to ochrophyte lineages, and modified to remove individual or pairs of CASH lineages. ‘x’ indicates that the topology in question was not obtained.
Figure 9—figure supplement 3. Single-gene tree topologies associated with individual plastid-encoded genes.

Figure 9—figure supplement 3.

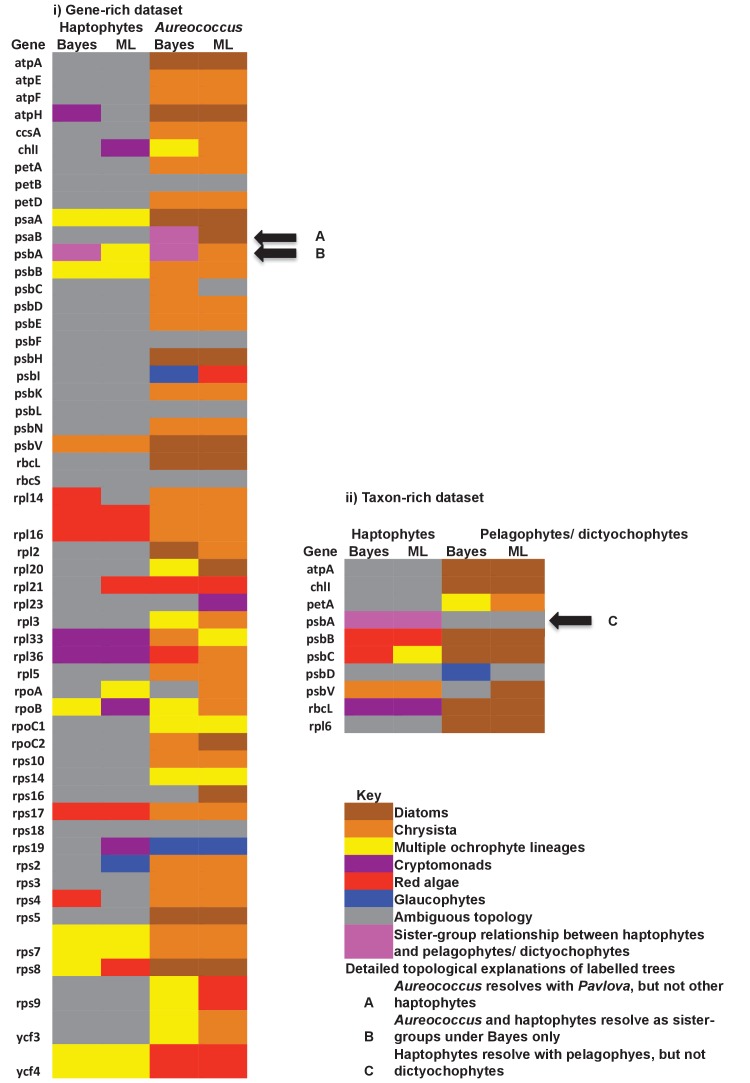
These heatmaps show the first sister-groups identified to haptophytes, and members of the pelagophyte/dictyochophyte clade, in single-gene trees of component genes included in concatenated trees of plastid-encoded proteins using both the gene-rich (i) and taxon-rich (ii) alignments. Topologies are given for trees inferred with MrBayes using the Jones substitution matrix, and RAxML trees inferred using JTT, under the same conditions as the multigene trees. The identity of the first sister-group is shaded according to the legend given below. Only three single-gene trees (labelled with black arrows) support any sister-group relationship between haptophytes and the pelagophyte/dictyochophyte clade; however, in each case (explained beneath the legend) this topology is not robustly supported, either due to polyphyly of one of the constituent lineages, or conflicting topologies identified via alternative methods.