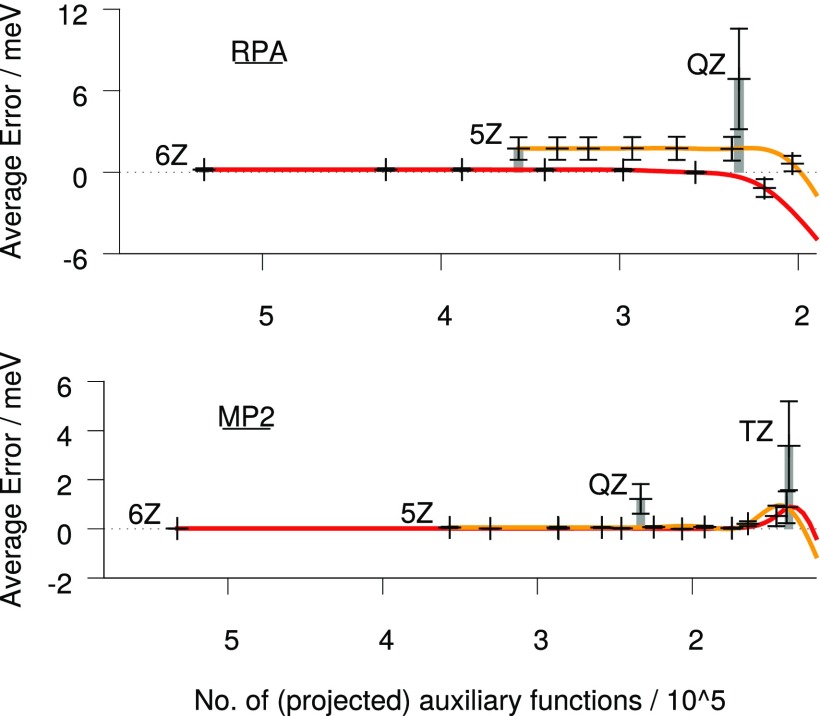
FIG. 1.
Mean errors (left axis) and standard deviations (error bars) against the number of auxiliary functions using ph-projection. Solid lines: Projection from cc-pV6Z-RI (red) and cc-pV5Z-RI (orange). Larger thresholds result in fewer auxiliary basis functions. Gray bars labelled XZ = 6Z, 5Z, QZ, TZ represent the corresponding unprojected cc-pVXZ-RI bases. Mean error and standard deviation nearly vanish for cc-pV6Z-RI. Null space removal grants sub-meV accuracy with an auxiliary basis set size only slightly larger than the canonical RI basis.

