
Figure 1. Significant changes in the detergent insoluble brain proteome increase with pathological severity.
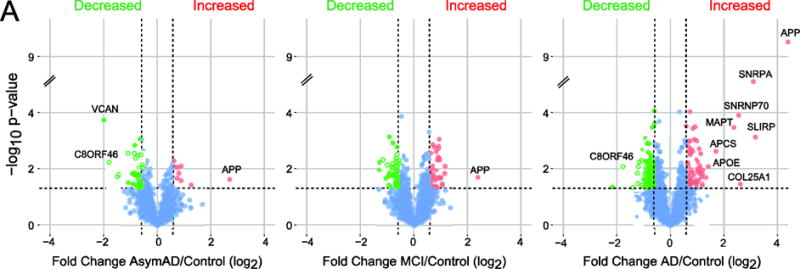
Volcano plots display the protein abundance (log2-fold-change) against the t-statistic (−log10(p-value)) for AsymAD/Control (left), MCI/Control (middle) and AD/Control (right). Red and green dots are differentially enriched or depleted proteins, respectively, whereas blue dots represent proteins that remain unchanged.