
Figure 3. Proteins and pathways increased in the detergent insoluble AD proteome.
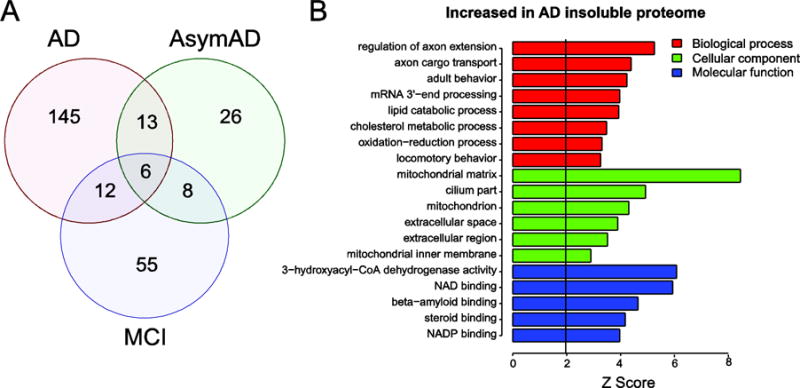
(A) Venn diagram for 265 proteins determined to be significantly altered (±1.5 fold and p value <0.05) among the three pairwise comparisons AsymAD, MCI and AD versus control cases, respectively. (B) Gene ontology (GO) analysis of the significantly enriched proteins for AD/control in the insoluble proteome reveals biological processes (red), cellular components (green) and molecular functions (blue) significantly over-represented (Z>1.96 is equivalent to p<0.05; above black line).