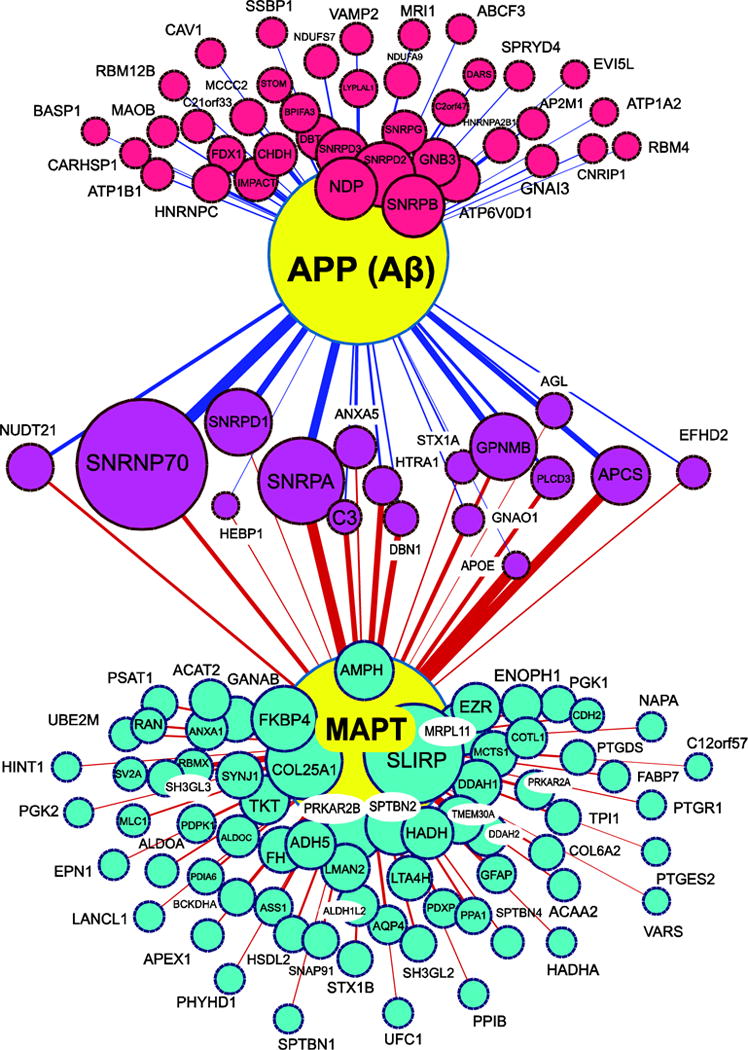
Figure 4. Network analysis of protein co-aggregation as specified by correlation with Aβ and Tau in detergent insoluble AD proteome.

Aβ (APP) and MAPT (large yellow nodes) correlate with various proteins measured in the insoluble proteome from the 35 cases analyzed and quantified by label-free MS quantification. Node size is proportional to significance (Z score) and edge weight is proportional to the bicor correlation value for each inferred pairwise interaction. A minimum bicor correlation of +0.40 to either tau or Aβ was required for consideration. Proteins most correlated to Aβ or tau are represented by red and turquoise nodes, respectively. Node sizes for the 17 magenta nodes reflecting proteins with significant cross-correlation to both Aβ and MAPT are based on the Z score of correlation with Aβ.
