
Figure 2. CDK7 inhibitor THZ1 disrupts DIPG growth.
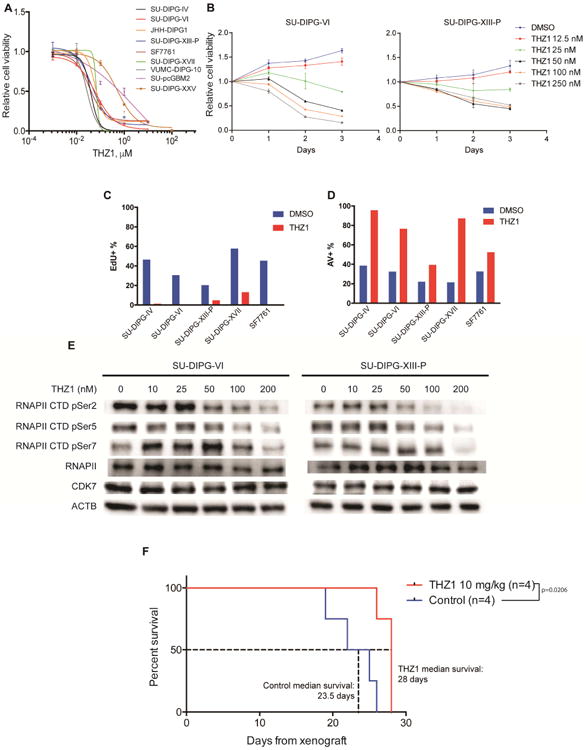
A) Patient-derived DIPG cultures (SU-DIPG-IV, SU-DIPG-VI, JHH-DIPG1, SU-DIPG-XIII-P, SF7761, SU-DIPG-XVII, VUMC-DIPG-10, SU-DIPG-XXV) and SU-pcGBM2 treated with THZ1 as indicated for 72 hours. Cell viabilities normalized to 0.1% DMSO control values (n=3 wells per data point). B) SU-DIPG-VI and SU-DIPG-XIII-P cells treated with THZ1 at indicated concentrations or 0.1% DMSO control. Cell viabilities measured at 0, 1, 2 and 3 days of treatment and normalized to day 0 values (n=3 wells per data point). C) EdU incorporation by DIPG cells treated with 0.1% DMSO or 0.1 μM THZ1 for 20 hours. D) Annexin V (AV)/DAPI staining of DIPG cells treated with 0.1% DMSO or 0.1 μM THZ1 for 48 hours. E) SU-DIPG-VI and SU-DIPG-XIII-P cells treated with THZ1 as indicated for 24 hours. Western blot analyses for phosphorylation levels at Ser2, Ser5 and Ser7 of RNA polymerase II C-terminal domain (RNAPII CTD). Total levels of RNAPII, CDK7 and beta-actin (ACTB) also measured as control. F) SU-DIPG-XIII-P* cells were xenografted to the pons at postnatal day 43 (P43) and allowed to engraft for 10 days prior to treatment. SU-DIPG-XIII-P* represents a particularly aggressive subclone of the SU-DIPG-XIII-P culture. Mice were treated with THZ1 at 10 mg/kg i.p. twice daily. Log-rank analyses were performed to calculate the p value, comparing vehicle treated and THZ1 treated groups (vehicle n=4 mice, THZ1 n=4 mice). Data are shown as mean ± SD unless otherwise indicated. FACS analysis shown in bar plots (C, D) for one representative experiment. See also Figure S2 and Table S3.